From the April 2016 issue of GCM magazine:
Summer deficit irrigation of bermudagrass
Deficit irrigation of bermudagrass in Southern California over two consecutive growing seasons showed that acceptable to minimally acceptable turf quality can be maintained at 63% to 41% reference evapotranspiration (ETo).
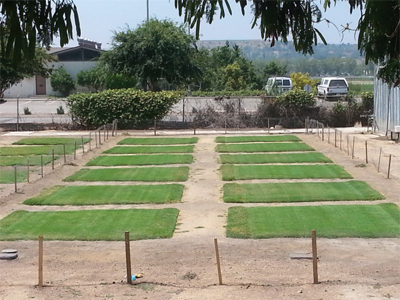
Research was carried out on well-established GN-1 hybrid bermudagrass plots at the Center for Turf, Irrigation and Landscape Technology at California State Polytechnic University, Pomona in Pomona, Calif. This photo was taken on July 7, 2015, in the second year of the study.
Photo by Emma R. McDonough
Robert Green, Ph.D.; Alan Moss, M.S.; Emma Rae McDonough, B.S.; Kelly Parkins, M.S.; Ramesh Kumar, Ph.D.; Eudell Vis, M.S.; Valerie Mellano, Ph.D.; and Grant Klein, M.A.
Read this story in GCM's digital edition »
In 2009 and 2010, legislation passed in California that required water suppliers to increase water use efficiency in both the agricultural and urban sectors, and to meet an overall goal of reducing per capita urban water use by 20% by Dec. 31, 2020 (12,13). Recent severe drought conditions have prompted the implementation of even more stringent water conservation measures. The California State Water Resources Control Board adopted an emergency regulation requiring an immediate 25% reduction in overall potable urban water use statewide, effective May 5, 2015 (5). Commercial, industrial and institutional properties (including golf courses) that are not served by a water supplier or supply their own water (for example, with a groundwater well) must also either reduce water use by 25%, or restrict outdoor irrigation to no more than two days per week. These emergency urban water use restrictions or modifications will continue as long as drought conditions persist in California (6). Landscape water use has the greatest potential for reduction of any urban water use sector, because approximately 30% to 50% of all urban water use is dedicated to landscape irrigation, depending on hydrological region.
Irrigating bermudagrass
Common bermudagrass [Cynodon dactylon (L.) Pers.] and hybrid bermudagrass [C. dactylon (L.) Pers. × C. transvaalensis (Burtt-Davy)] are the most commonly used turfgrass species for golf courses and sports fields in Southern California and in warm climates across the southern United States. Bermudagrass is also used on parks and lawns. The growth characteristics, overall appearance and adaptation of bermudagrass to southern climates give turf managers a quality turf that will respond well to a range of maintenance levels.
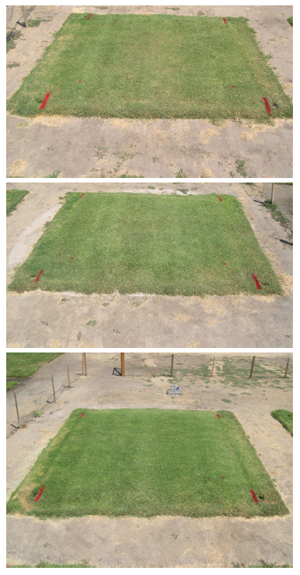
Photos taken on Sept. 3, 2015 show the turf quality at 50% optimal irrigation (top), 75% optimal irrigation (middle) and 100% optimal irrigation (bottom).
Photos by Robert L. Green
“Deficit irrigation,” the practice of irrigating bermudagrass below optimal conditions (technically, below ETcrop), allows soil and turfgrass tissue to gradually dry during summer, which helps conserve water, maintain water budgets, save on operating costs and more. Depending on the degree of deficit, bermudagrass can continue to provide a satisfactory playing surface, sufficient growth and recuperative ability, and acceptable (compared with minimally acceptable or lower) turfgrass quality during the entire warm season. Since deficit irrigation has become more widely used, two questions have arisen: What is the minimum amount of irrigation needed to maintain acceptable turfgrass quality for the entire warm season, and what is the minimum amount of irrigation required if lower turfgrass quality is suitable for varying periods of time?
Calculating irrigation water requirements
Most golf course superintendents and turf managers irrigate according to several factors, such as site conditions and reference evapotranspiration (reference ET or ETo). However, optimal conditions that can be used in research as a standard check treatment to compare with deficit irrigation treatments, as is the case in this study, can be calculated as “crop ET under standard conditions” (ETcrop), which can then be multiplied by a run-time multiplier (RTM) to calculate irrigation water requirement. The RTM (8), also called a “scheduling multiplier,” adjusts for the lack of irrigation distribution uniformity (DU) and helps approximate the upper irrigation scheduling boundary. A portion of the RTM, including none, can be used, depending on turfgrass use expectations.
The crop coefficient (Kc) approach for calculating ETcrop under standard conditions uses the calculation: ETcrop = Kc × ETo, where standard conditions are considered optimal or well watered (1). Reference ET is defined as the ET rate of an actively growing reference crop not limited by soil water content and that has specified plant and biophysical characteristics. It serves as an evaporative index and can be used with Kc (which accounts for the ET difference between the crop of interest and the reference crop) to calculate ETcrop under standard conditions.
The American Society of Civil Engineers (ASCE) developed the ASCE Standardized Reference Evapotranspiration Equation and calculation procedures to bring commonality to calculating ETo in order to provide a standardized basis for determining or transferring Kc for agricultural and landscape use (2). The basis of the standardized reference ET equation is the ASCE Penman-Monteith (PM) equation. In California, the most commonly accepted source of ETo data (particularly for water regulators) is the California Irrigation Management Information System (CIMIS) (4), which uses the modified Penman equation with a wind function to estimate ETo. In addition to the CIMIS ETo, CIMIS also provides ETo values estimated using the PM equation. Studies have shown that there are no statistically significant differences between PM-derived ETo and CIMIS ETo.
A short and recent history of deficit irrigation
Previous deficit irrigation studies involving bermudagrass — not including extreme deficit irrigation studies — have generally reported success, though results vary. In a study published in 1987 (10), six turfgrass species were irrigated at 100%, 80% and 60% of calculated ETcrop (× 1.35 adjustment for DU) for nearly three years in Irvine, Calif. Results showed that the overall turfgrass quality, which was more than acceptable, was not significantly affected by irrigation treatments. A study in Tucson, Ariz. (3), reported that 66% to 75% ETo for bermudagrass varieties and 75% to 80% ETo for seashore paspalum (Paspalum vaginatum Swartz.) varieties was needed to produce at least minimally acceptable visual turfgrass quality. This work, which used a linear-gradient irrigation system, tested a total of seven varieties that were irrigated daily, mowed at 0.63 inch (1.6 cm), and grown on a Glendale silt loam soil.
|
 |
|
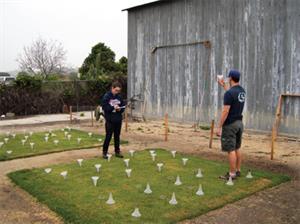
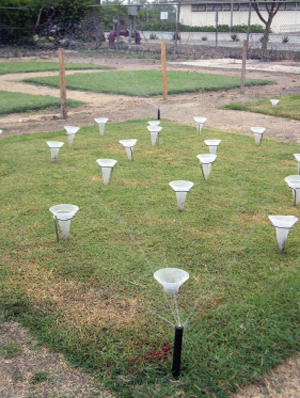
In both 2014 and 2015, two to four catch-can tests per plot were carried out before the studies had started. The purpose of the tests was to determine low-quarter distribution uniformity (DULQ) and precipitation rate of each plot.
|
More recent work in Texas (14) reported that the irrigation requirement for maintaining minimally acceptable visual turfgrass quality during summer was: 10% to 15% ETo for fine-textured, sports-type bermudagrass varieties; 15% to 20% ETo for medium-textured amenity bermudagrass and Japanese lawn grass (Zoysia japonica Steud.) varieties; and 25% to 33% ETo for Manilagrass (Z. matrella) varieties. This work used a linear-gradient irrigation system located in Dallas, and tested a total of 15 varieties that were irrigated twice a week, mowed at two heights of cut (high = 2 inches [5 cm]; low = 0.50 inch [1.27 cm] or 1.0 inch [2.5 cm], depending on species), and grown on a Houston clay soil.
Hybrid bermudagrass grown in Manhattan, Kan., was reported to have acceptable turfgrass quality throughout the warm season when uniformly irrigated twice a week by hand at 60% ETactual (approximately the same as calculated 60% ETcrop) from June to September (7). Additionally, the 40% ETactual treatment produced warm-season-long acceptable turfgrass quality, except for one rating date, in the first season of the two-season study. It should be noted that some additional water would be needed to compensate for DU.
The primary objective of this study was to begin to define irrigation requirements for a range of bermudagrass visual quality and color ratings during the warm season (average rating for an entire warm season ranges from 4 to 7). Ratings were specific to all bermudagrass varieties and cultural practices, except for putting greens, and were on a scale of 1 to 9 (where 1 = dead or brown; 5 = minimally acceptable; 6 = acceptable; and 9 = maximum quality or color).
Materials and methods
This study was conducted from June to September 2014 and 2015 on 12 well-established GN-1 hybrid bermudagrass plots (each 10 feet × 10 feet [3 meters × 3 meters]) located at the Center for Turf, Irrigation and Landscape Technology (CTILT) at California State Polytechnic University, Pomona in Pomona, Calif. Plots were sodded in 2002, located in full sun, and separated by 3-foot borders. Each plot was individually zoned and controlled and had a rotating nozzle sprinkler at each of the four corners.
Soil test results from a 12-plot composite soil sample at the beginning of the study were as follows: soil texture = sandy clay loam; pH = 7.4; organic matter = 4.6%; cation exchange capacity = 30 meq/100 grams; ECe = 1.5 decisiemens/meter; and sodium adsorption ratio (SAR) = 1.9. Average test results of the recycled water used for irrigation at the beginning and end of the 2014 study were as follows: pH = 7.3; ECw = 1.04 decisiemens/meter; and SARadj = 2.86.
Irrigation treatments
Three irrigation amounts (treatments) were arranged in a randomized complete block design with four replications. Treatments were assigned to blocks (replications) based on the low-quarter irrigation distribution uniformity (DULQ) of each plot. A reassignment (randomization) was conducted for the 2015 study. Treatments were calculated so that the irrigation during the summer was 100%, 75% and 50% optimal. Treatments were applied from June 6 to Sept. 25, 2014 (16 weeks), and from June 4 to Sept. 3, 2015 (13 weeks). The 2015 study was terminated early (Sept. 3) because of unusual precipitation (1.45 inches) on Sept. 15.
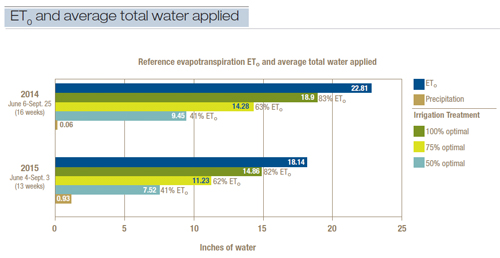
Figure 1. Reference evapotranspiration (ETo) and average total water applied to research plots at the Center for Turf, Irrigation and Landscape Technology at California State Polytechnic University, Pomona in Pomona, Calif. Daily reference evapotranspiration (ETo) and precipitation were obtained from a California Irrigation Management Information System (CIMIS) weather station located approximately 0.25 mile from the study plots. The second year of the study was terminated early because of excessive rainfall (1.45 inches) on Sept. 15, 2015. Irrigation treatments were scheduled each week and based on several factors: previous seven-day ETo; warm-season turf monthly crop coefficients; 100%, 75% and 50% calculated ETcrop; and a run-time multiplier based on DULQ for each plot. The % reference evapotranspiration (%ETo) = (average total water applied/ ETo) ×100.
The amount of weekly irrigation for each plot was calculated based on several factors and programmed into the irrigation controller each Friday. Treatment water use factors included: previous seven-day cumulative ETo obtained from a CIMIS weather station located approximately 0.25 mile from the plots; monthly warm-season turfgrass Kc developed in Irvine, Calif. (11); and a treatment level of either 100%, 75% or 50% calculated ETcrop.
The amount of weekly irrigation for each plot was determined by multiplying calculated treatment water use by an RTM based on the DULQ of each plot (8). Weekly irrigation run time for each plot was calculated by dividing weekly irrigation amount by the precipitation rate (PR) of each plot and then converting to minutes. This time was divided by six (three irrigation days per week and two cycle starts per irrigation day) to prevent runoff and maximize infiltration. During the two-season study, one irrigation day on July 22, 2015, was canceled because of 0.70 inch precipitation.
Before the 2014 and 2015 studies, two to four catch-can tests were carried out per plot, with 24 catch-cans in each plot to determine DULQ and precipitation rate of each plot (12-plot average DULQ and precipitation rate were 75% and 1.10 inches [2.79 cm]/hour, respectively, for 2014; and 74% and 1.10 inches/hour, respectively, for 2015).
Every two weeks, the irrigation system of each plot was checked and adjusted to ensure maximum DU. The irrigation run time to perform these checks (one or two minutes) was added to the weekly total irrigation run time for each plot. A flow gauge on the main line to the plots was used to check that irrigation treatments ran each week.
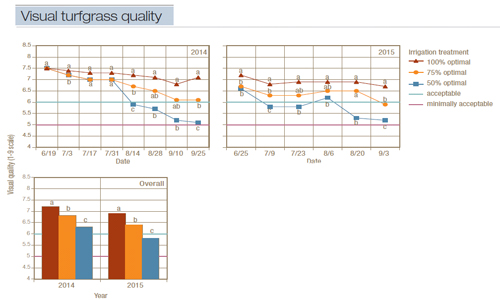
Figure 2. The effect of irrigation treatments on visual turfgrass quality of GN-1 bermudagrass managed under representative conditions from June to September 2014 and 2015 in Pomona, Calif. Quality ratings were specific to all bermudagrass varieties and cultural practices, except for putting greens (1 to 9 scale; 1 = dead or brown; 5 = minimally acceptable; 6 = acceptable; and 9 = maximum quality). In the line graphs, different letters for a single date indicate significant differences between or among means. In the bar graph, different letters above columns within a year indicate significant differences between or among overall means. LSD, P = 0.05.
Prior to the 2014 and 2015 studies, plots were well irrigated to ensure uniform soil water content in the 0- to 12-inch (0- to 30.48-cm)root-zone depth. During the time between studies, plots were irrigated to prevent visual drought symptoms. In terms of plot appearance, the 2014 study had no observable effect on the 2015 study.
Height of cut
Plots were mowed two days per week with a walk-behind reel mower. Height of cut was 0.75 inch (1.9 cm) during the 2014 study, and 0.87 inch (2.2 cm) during the 2015 study. Problems with mowers caused the change in height of cut for the 2015 study. To ensure maximum DU, turfgrass in the vicinity of irrigation heads was not mowed during routine mowing, but was either trimmed (2014) or mowed at a higher height of cut with a rotary mower with wheels not rolling over heads (2015). Plots were fertilized by hand once every two weeks at a nitrogen rate of 0.30 pound/1,000 square feet (1.46 grams/square meter) with a 16N-6P2O5-8K2O granular fertilizer.
Turf quality
Visual turfgrass quality and color ratings were taken once every two weeks and based on the rating scale mentioned previously. The first scheduled rating was not taken in 2015 because turfgrass and treatments were not representative. Ratings were taken from the center 7-foot (2.13-meter) square within each plot to reduce the potential impact of irrigation patterns on plot borders. Ratings were taken nine days after fertilization and two days after mowing.
Results
Irrigation treatments were applied from June to September in 2014 (16 weeks) and in 2015 (13 weeks). The data are summarized in Figure 1. The 2015 study was terminated early (Sept. 3) because an unusual 1.45 inches (3.68 cm) of precipitation fell on Sept. 15. Average total water applied for treatments for the duration of the studies was similar during both years in terms of percent ETo (100%, 75% and 50% optimal were approximately 83%, 63% and 41% ETo, respectively). There was 0.06 inch (0.15 cm) of precipitation in 2014 and 0.93 inch (2.36 cm) in 2015.
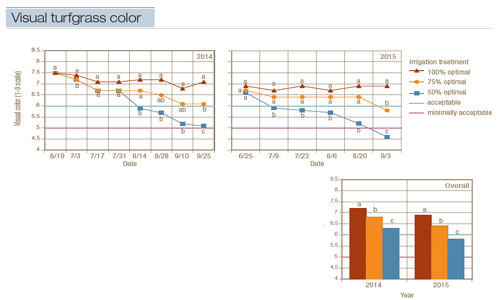
Figure 3. The effect of irrigation treatments on visual turfgrass color of GN-1 bermudagrass managed under representative conditions from June to September 2014 and 2015 in Pomona, Calif. Color ratings were specific to all bermudagrass varieties and cultural practices, except for putting greens (1 to 9 scale; 1 = dead or brown; 5 = minimally acceptable; 6 = acceptable; and 9 = maximum quality). In the line graphs, different letters for a single date indicate significant differences between or among means. In the bar graph, different letters above columns within a year indicate significant differences between or among overall means. LSD, P = 0.05.
As shown in Figures 2 and 3, visual turfgrass quality and color were significantly affected by treatment and date during both studies. During both years, overall average visual turfgrass quality and color was greater than 6.0 (acceptable) for the 100% and 75% optimal treatments; the 50% optimal treatment was not lower than 5.7, which is considerably higher than the minimally acceptable rating of 5.0. The results from the 2015 study would have been lower if the study had not been terminated early.
Generally, ratings were somewhat lower during the 2015 study. One possible explanation is that percent gravimetric soil water content at the beginning of the study was higher in the 2014 study than in the 2015 study (data not shown). Average soil water content for 12 plots and two root-zone depths spanning the 0- to 12-inch profile = 26% in 2014 and 23% in 2015 (field capacity for a sandy clay loam is approximately 20%).
Conclusions
This study tested deficit irrigation treatments in Southern California during two consecutive warm seasons when bermudagrass ET and potential water savings were the highest. The goal of the irrigation treatments was to produce reasonable average turfgrass quality and color during the entire warm season (an average rating of 4 to 7).
Depending on turfgrass use and expectations, turf managers can use different levels of deficit irrigation on different areas of the golf course, such as on fairways and roughs. The 100% optimal treatment (83% ETo for the duration of the warm season) was considered a standard check treatment because irrigation amount was calculated for 100% ETcrop plus (all of) a scheduling multiplier was used to compensate for the lack of DU (average plot DULQ was 75% in 2014 and 74% in 2015). Results from this study indicate that 75% to 50% optimal (63% to 41% ETo, respectively, for the duration of the warm season) can be used while maintaining acceptable to minimally acceptable bermudagrass quality and color.
In Southern California, approximately 60% to 70% ETo is commonly used during the summer months to produce warm-season-long acceptable bermudagrass quality (personal communication with golf course superintendents). This amount includes an unknown extra amount of irrigation to account for DU, and does not include golf courses in the Southern California low desert, such as the Palm Springs area. The 50% optimal treatment (41% ETo for the duration of the warm season) could be too low for many situations because results from deficit irrigation will vary because of multiple factors, such as soil texture and organic matter, climate, antecedent soil water content, grass maturity, cultural conditions, DU, and irrigation water quality. In our study, total salts did not build up appreciably in the 0- to 12-inch soil profile (data not shown) because we were irrigating with a high-quality recycled water. In other situations, salt buildup could be a problem. Fortunately, bermudagrass has been reported to possess the highest salt-tolerance rating (tolerant) (9).
Acknowledgments
This project was supported by the California State University Agricultural Research Institute (ARI) Grant number 14-04-210. Special thanks to Alan Moss, Eudell Vis and Ramesh Kumar for all of their work and expertise on irrigation system topics.
Literature cited
- Allen, R.G., L.S. Pereira, D. Raes and M. Smith. 1998. Crop evapotranspiration - Guidelines for computing crop water requirements. FAO Irrigation and drainage paper 56. (www.fao.org/docrep/X0490E/X0490E00.htm). Accessed Feb. 9, 2016.
- American Society of Civil Engineers-Environmental and Water Resources Institute (ASCE-EWRI). 2016. The ASCE standardized reference evapotranspiration equation. R.G. Allen, I.A. Walter, R. Elliott, T. Howell and D. Itenfisu, eds. American Society of Civil Engineers-Environmental and Water Resources Institute. (www.kimberly.uidaho.edu/water/asceewri/ascestzdetmain2005.pdf). Accessed Feb. 9, 2016.
- Banuelos, J.B., J.L. Walworth, P.W. Brown and D.M. Kopec. 2011. Deficit irrigation of seashore paspalum and bermudagrass. Agronomy Journal 103:1567-1577.
- California Irrigation Management Information System (CIMIS). 2016. (www.cimis.water.ca.gov). Accessed Feb. 9, 2016.
- California State Water Resources Control Board (CWRCB). 2015. State water board adopts 25 percent mandatory conservation regulation. (www.waterboards.ca.gov/press_room/press_releases/2015/pr050515_water_conservation.pdf). Accessed Jan. 29, 2016.
- California State Water Resources Control Board (CWRCB). 2016. State water board adopts extended emergency water conservation regulation. (www.waterboards.ca.gov/press_room/press_releases/2016/pr2316_reg_extension.pdf). Accessed Feb. 9, 2016.
- Fu, J., J. Fry and B. Huang. 2004. Minimum water requirements of four turfgrasses in the transition zone. HortScience 39:1740-1744.
- Irrigation Association and Golf Course Superintendents Association. 2003. Certified golf irrigation auditor, p. 79. Table 3-8. Conversion table from lower quarter distribution uniformity to RTM. The Irrigation Association, Falls Church, Va.
- Maas, E.V., and G.J. Hoffman. 1977. Crop salt tolerance: Current assessment. Journal of Irrigation and Drainage Engineering: (ASCE)103(IR2):115-134.
- Meyer, J.L., and V.A. Gibeault. 1987. Turfgrass performance when underirrigated. Applied Agricultural Research 2(2):117-119.
- Meyer, J.L., V.A. Gibeault and V.B. Youngner. 1985. Irrigation of turfgrass below replacement of evapotranspiration as a means of water conservation: Determining crop coefficient of turfgrasses. Pages 357-364. In: F. Lemaire, ed. Proceedings of the 5th International Turfgrass Research Conference, Avignon, France, July 1985. INRA Publications, Versailles, France.
- State of California. 2009. Senate Bill X7-7, Water Conservation Act of 2009. (www.dwr.water.ca.gov/wateruseefficiency/sb7/docs/SB7-7-TheLaw.pdf). Accessed Feb. 11, 2016.
- State of California. 2010. 20x2020 Water Conservation Plan. (www.swrcb.ca.gov/water_issues/hot_topics/20x2020/docs/20x2020plan.pdf). Accessed Feb. 11, 2016.
- Wherley, B., J. Heitholt, A. Chandra and P. Skulkaew. 2014. Supplemental irrigation requirements of zoysiagrass and bermudagrass cultivars. Crop Science 54:1823-1831.
✉ Robert Green is an adjunct professor and lecturer, Ramesh Kumar is a professor emeritus, Eudell Vis is a professor emeritus, and Valerie Mellano is professor and chair in the plant science department at California State Polytechnic University, Pomona in Pomona, Calif. Alan Moss, formerly a graduate student at California State Polytechnic University, Pomona, is now an irrigation designer at Water Concern Ltd., Rancho Santa Margarita, Calif. Emma Rae McDonough recently received her bachelor of science in environmental biology from California State Polytechnic University, Pomona, and is currently a biological science technician at Citrus Research Board. Kelly Parkins, previously a lecturer in the department of plant sciences, California State Polytechnic University, Pomona, is now superintendent of park maintenance and development for the City of Long Beach, Calif. Grant Klein, formerly a staff research associate at the University of California, Riverside, is now a technical editor at Statistical Research in Redlands, Calif.