From the May 2016 issue of GCM magazine:
Effects of deficit irrigation and traffic on Tifway fairways
Even during drought in summer, Tifway fairways can maintain minimally acceptable quality with little irrigation and traffic typical of a golf course setting.
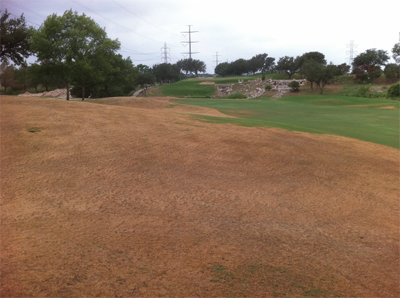
Superintendents facing water shortages and water restrictions mandated by government agencies often reduce overall irrigated acreage but continue to irrigate high-priority turfgrass areas at full irrigation levels.
Photo by Travis Moore
Benjamin Wherley, Ph.D.; Reagan W. Hejl, M.S.; Charles H. Fontanier, Ph.D., and Richard H. White, Ph.D.
Read this story in GCM's digital edition »
As drought and population growth place increasing strains on water supplies, golf course superintendents are now, more than ever, faced with tough decisions about how to best conserve irrigation to meet the demands of their turfgrass. This situation is reflected in the recent Golf Course Environmental Profile (2), which reported that U.S. golf course water use decreased 21.8% from 2005 to 2013. One strategy that superintendents have implemented to achieve this change has been to reduce overall irrigated acreage while continuing to irrigate high-priority areas at full irrigation levels. Another approach employed during more critical periods of water conservation is to irrigate turfgrass areas at deficit levels of irrigation, which involves intentionally irrigating at less than the maximal water use rate for turfgrass (3). In addition to reducing overall water use, this practice can decrease shoot growth and mowing requirements.
Reference evapotranspiration (ETo) data offer a way of estimating water demand for various crops within different climates, or across a growing season. ETo is usually presented in terms of inches or millimeters of water per day and is based on a number of factors, including temperature, solar radiation, wind and relative humidity. ETo may be accessed via local weather stations, state weather networks or university extension information, and may be used on a daily, weekly or historical basis in developing an appropriate water budget for a golf facility. In order to estimate actual water requirements for a given crop (turfgrass is considered a crop), ETo must be multiplied by an appropriate crop coefficient (Kc), which may range from 50% to 120% of ETo, depending on the crop species. A suggested year-round Kc value for warm-season turfgrasses of 0.6 (that is, 60% × ETo) (7) has become a widely accepted value for meeting consumptive irrigation requirements of warm-season turfgrasses. Because cool-season turf species have slightly higher transpiration rates, a Kc value of 0.8 (that is, 80% × ETo) has generally been considered appropriate for meeting maximal water requirements.
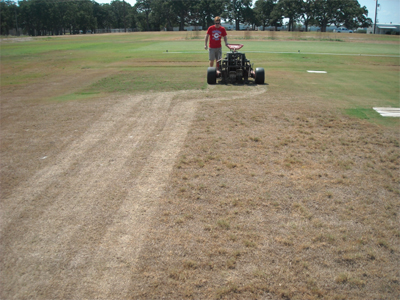
In July and August of both years of the study, a modified Cady traffic simulator equipped with soft-spike golf cleats was used to simulate summer traffic stress. Half of each plot received six passes weekly.
Photos by Ben Wherley
Because turf is maintained for aesthetic and functional purposes rather than yield, it can be maintained with acceptable appearance at deficit irrigation levels. Irrigating to full Kc levels of 0.6 or 0.8 × ETo would produce ideal turf quality and maximize growth, but deficit irrigation could be implemented to achieve water-use reduction goals while still supporting a visually acceptable and functional playing surface. Although bermudagrass has good wear and recuperative ability, the extent to which irrigation levels can be reduced on trafficked bermudagrass fairways in summer without negatively affecting quality, function and recovery has not been fully examined. For the arid Southwest, researchers (1) have suggested irrigating to 0.8 × ETo in high-traffic situations to avoid stressing the turf.
Finally, allowing turf to go dormant by withholding irrigation entirely during water conservation periods may be the only option in more extreme situations in which irrigation is not possible or must be prioritized to greens and tees. In these situations, autumn rainfall becomes critical for achieving turf recovery before the next season. Warm-season grasses generally possess good summer dormancy mechanisms and have been shown to be capable of withstanding and recovering from 60 days of summer drought with no precipitation or irrigation, so long as they are well established in deep soil (10).
The goals of this project were to better quantify effects of traffic and deficit irrigation on bermudagrass fairway performance in the South Central region of the U.S. To accomplish this, we characterized the response of Tifway bermudagrass fairways to irrigation levels of 60%, 45%, 30% and 0% × ETo, with and without simulated summer traffic. We also evaluated the effects of successive summers of deficit-irrigated or unirrigated conditions on autumn recovery following resumption of full irrigation levels in September.
Methodology
This study was conducted during the 2012 and 2013 seasons at the Texas A&M Turfgrass Research Laboratory in College Station, Texas. Field research plots consisted of established Tifway bermudagrass (Cynodon dactylon × C. transvaalensis) grown on a Boonville fine sandy loam soil. The study was arranged in a split-plot design with three replicate plots per treatment. Irrigation main plots (20 feet × 10 feet [6.0 meters × 3.0 meters]) were subdivided into two 20-foot × 5-foot (6.0-meter × 1.5-meter) subplots for applying summer traffic to plots. Plots were mowed three times weekly at 0.5-inch (1.2-cm) height throughout the season with clippings returned, and received 0.75 pound nitrogen/1,000 square feet (3.6 grams/square meter) from a 50% methylene urea fertilizer every six weeks from April through August.

Table 1. Monthly total rainfall and evaporative demand (ETo) during the 2012 and 2013 seasons. Data were collected via an on-site Texas ET network weather station
(http://texaset.tamu.edu).
Irrigation. Irrigation was applied three times weekly from April through August of both years. Irrigation treatments, in diminishing order, included: 60% × ETo (warm-season Kc), 45% × ETo, 30% × ETo, and 0% × ETo (unirrigated = rainfall only). A local weather station, meeting the specifications of the Texas ET Network (http://texaset.tamu.edu) was used to determine ETo replacement irrigation. On-site rain gauges were used for determining contributions from rainfall, which were accounted for when determining weekly water requirements. In early September of both years, full (60% × ETo) irrigation levels were resumed in all plots to promote and evaluate recovery from water stress.
Traffic stress. To simulate summer traffic stress in this study, irrigation main plots were subdivided with half of each plot receiving traffic (six passes weekly) during July and August from a modified Cady traffic simulator (11) equipped with soft-spike golf cleats.
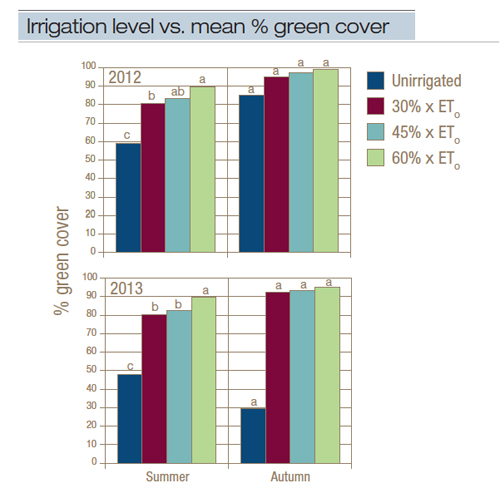
Figure 1. Effect of irrigation level on mean percent green cover of untrafficked plots during summer (May through August) and after eight weeks of autumn recovery at full irrigation levels. Means with the same letter within each year are not significantly different.
Green cover. Plots were analyzed for percent green cover using the Karcher macro and SigmaScan digital image analysis software (8). Digital images were taken twice monthly from May through December using a Nikon Coolpix digital camera mounted on a 0.6-meter × 0.6-meter (1.9-foot × 1.9-foot) square light box that was randomly positioned within each plot. The light box cancelled out outside light and created uniform light within the box. For reference, >75% green cover was generally found to correspond well to minimally acceptable visual turf quality ratings.
Divot recovery. The study also assessed divot recovery time in response to irrigation. In July of each year, a modified edger consisting of a series of stacked blades was used to create four uniform divots (2 inches wide × 3 inches long [5.0 cm × 7.6 cm]) in each plot (4). Divots were backfilled with either sand or sand/peat (90:10 volume:volume) infill and analyzed after 45 days via digital analysis of light box images to evaluate regrowth in the divoted areas.
As an indicator of turf stress, reflective canopy temperatures were also measured during the midafternoon hours on cloudless days using an infrared hand-held temperature gauge.
Root growth. In September of both years, root growth within the upper 12 inches (30.4 cm) of soil was evaluated using a 2-inch (5-cm) diameter hydraulically driven sampling probe. Root/soil samples were rinsed to remove soil and oven-dried for 72 hours at 149 F (65 C) before weighing.
Results and discussion
In comparing April-through-August rainfall and evaporative demand (ETo) between seasons, rainfall was slightly higher during 2013: 9.4 inches (24 cm) for 2012, and 11.4 inches (29 cm) for 2013 (Table 1). Most of the rainfall in 2013 occurred in May. Evaporative demand at the site was approximately 18% greater in 2013: 31.8 inches (81 cm) for April-August 2012 and 37.4 inches (95 cm) for April-August 2013). ETo at the site ranged from 0.19 to 0.31 inch (0.5 to 0.8 cm)/day during summer 2012, and peaked at 0.4 inch (1.1 cm)/day in the summer of 2013 (data not shown).
Deficit irrigation effects on untrafficked green cover

†Late summer data are mean of ratings for July through early September. Autumn recovery data were taken eight weeks after full irrigation levels were resumed in all plots beginning in early September.
‡Traffic was applied weekly during July and August.
Table 2. Effects of summer traffic and irrigation level on percent green cover of fairway plots during 2012 and 2013. Means followed by the same letter within each rating period are not significantly different.
During 2012, irrigating untrafficked plots at full irrigation levels (60% × ETo) supported 90% overall green cover (Figure 1). Reducing irrigation to levels of 45% or even 30% × ETo resulted in >80% overall green cover when averaging across all rating dates. Perhaps not surprisingly, unirrigated plots declined rapidly to less than 15% green cover by July, but still maintained 59% overall green cover throughout 2012. In 2013, 60% × ETo irrigation again supported 90% mean green cover in plots (Figure 1). Irrigating at 45% × ETo resulted in below 75% green cover only once in early September, and 30% × ETo irrigation levels resulted in below 75% green cover three times during July and August. Similar to 2012, unirrigated plots fell to a low of 12% green cover by late August, but maintained an overall green cover of 48%, taking into account all rating dates.
Autumn recovery
To promote autumn recovery, full irrigation amounts (60% × ETo) were resumed in all plots in early September of both years. In 2012, both deficit-irrigated treatments exhibited rapid recovery, finishing the season with turf quality and green cover ratings similar to those of the fully irrigated controls by November (Figure 1). Remarkably, the unirrigated treatment also showed substantial recovery during the eight-week autumn period, attaining a final 85% green cover level that was statistically similar to the other treatments.
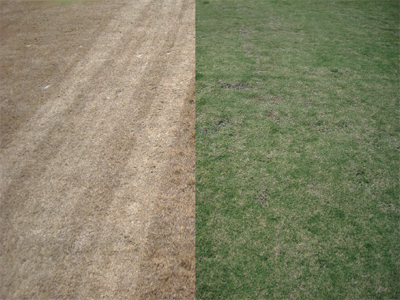
In 2012, both deficit-irrigated treatments exhibited rapid recovery, and the unirrigated treatment (shown here) also showed substantial recovery during the eight-week autumn period, attaining a final 85% green cover level (right) that was statistically similar to the other treatments.
Following the 2013 season, deficit-irrigated plots again showed rapid autumn recovery and, by November, had attained final green cover and quality ratings statistically similar to those of the fully irrigated treatment (Figure 1). However, 2013 was unlike 2012 for unirrigated plots, which rebounded to only 25% green cover by the end of the 2013 autumn recovery period. Furthermore, only one of the three unirrigated plots had fully recovered by the start of the following spring.
Summer traffic on fairway green cover
Simulated traffic was imposed during July and August of both years. In both years, traffic resulted in a significant decrease in green cover within all irrigation treatments (Table 2). In 2012, traffic reduced green cover by approximately 30% in both 45% and 60% × ETo treatments, and by as much as 95% in unirrigated plots. In 2013, traffic reduced green cover by only 10% in 45% and 60% × ETo treatments, and by approximately 60% in unirrigated plots. Despite these differences in summer cover caused by traffic stress, turf in all treatments recovered to statistically similar green cover levels by late fall in both years (Table 2).
Canopy temperatures
Fully irrigated plots in our study generally exhibited the lowest temperatures (at or slightly above the ambient air temperature) (Figure 2). The greatest increases in canopy temperatures were most apparent in unirrigated plots, where temperatures on some dates increased by as much as 40 F (25 C) between irrigated and unirrigated treatments. Significant temperature differences between fully irrigated and deficit-irrigated treatments were less apparent from date to date. When averaging across the season (May to September), overall mean canopy temperatures of the 30% and 45% × ETo treatments were similar, and generally only slightly elevated relative to the fully irrigated controls. One of the environmental and human benefits offered by turfgrass systems is heat mitigation. Through transpirational cooling, irrigated turfgrasses dissipate thermal energy and have a positive impact on human comfort levels. Although deficit irrigation may help sustain water resources, it also, to some extent, increases environmental heat loading. However, unirrigated plots exhibited significantly higher temperatures than those receiving deficit levels.
Divot recovery
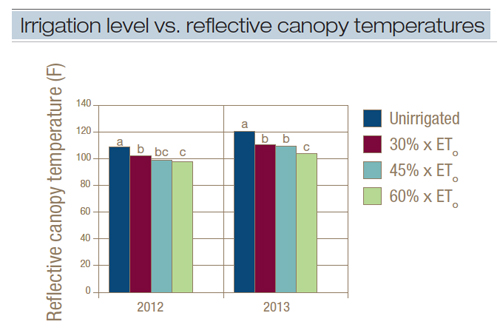
Figure 2. Effect of irrigation level on reflective canopy temperatures in plots. Data were taken May through August during midafternoon hours on cloudless days. Means followed by the same letter within a given year are not significantly different.
We found no differences in divot recovery time caused by infill mix (sand vs. sand/peat mix) in either year. However, irrigation level significantly affected divot recovery in both years of the study (Figure 3). Divot recovery after 45 days varied from as low as 10% to 20% green cover for unirrigated treatments to nearly 80% green cover in the 60% × ETo treatment. In 2012, after 45 days of recovery, the fully irrigated 60% × ETo treatment had 76% percent regrowth into divots compared with 40% and 60% green cover for the 30% and 45% × ETo treatments, respectively. In 2013, all irrigated plots recovered at similar rates, with only unirrigated plots exhibiting increased recovery time.
Why delayed divot recovery was observed with lower irrigation levels in 2012 but not in 2013 is difficult to explain, especially given that rainfall was similar between the seasons and ETo was considerably higher in 2013. Divot recovery results within the unirrigated treatments were consistent between years, emphasizing the importance of providing minimal levels of supplemental irrigation for promoting healing of divots. Our results also showed that the addition of peat moss to the infill mix provided no measurable benefit compared with using sand alone. This may be due in part to the fairly small amount of divot mix required to fill the divots. It should be noted that previous studies from cool-season turf have shown differences caused by infill mix. Irrigation level was not included as a factor in those studies, however (9).
Treatment effects on root development
Root mass (0 to 12 inches [0 to 30.4 cm]) increased from 2012 to 2013 within all treatments. While there was no detectable effect of irrigation level on root mass at the end of the first summer, irrigation level led to significant impacts on rooting in the second season (data not shown). During 2013, root dry weights increased with increasing irrigation level, with the exception of the 0.45 × ETo and 0.6 × ETo irrigation treatments, which had statistically similar root weights. The lack of detectable irrigation treatment effects on rooting in 2012 may have been due to residual carry-over of root system from before treatments were initiated. Furthermore, the overall increased root development observed between 2012 and 2013 may have been a result of increased management intensity (fertilizer inputs, gypsum and frequent mowing) relative to historical maintenance of the study area.
Conclusions
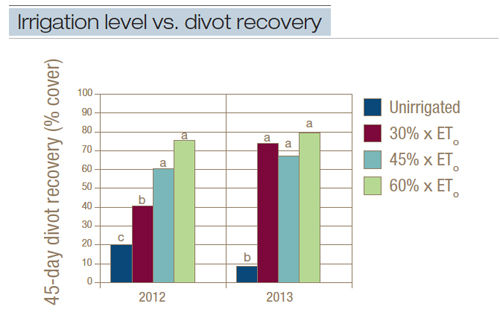
Figure 3. Effect of irrigation level on divot recovery (% green cover in divot after 45 days). Means with the same letter within each year are not significantly different.
In this study, conducted over two seasons with irrigation supplied three days per week, untrafficked Tifway bermudagrass maintained minimally acceptable quality for much of the season when irrigated at levels of nearly half of the commonly recommended Kc of 0.6 (60% × ETo). Addition of summer traffic did, however, necessitate increasing irrigation levels to compensate for the effects of traffic in 2012, but not in 2013. For bermudagrass and other warm-season turfgrasses, a Kc value of 0.6 or 0.65 has been widely accepted for meeting consumptive water use of actively growing turfgrass, and would likely be the baseline amount for golf course superintendents implementing ET-based irrigation scheduling (5,6,7).
Although each situation is different, data from this study suggest that during periods of water conservation, irrigation of bermudagrass turf can potentially be reduced to as low as 30% × ETo for up to two consecutive growing seasons while still maintaining minimally acceptable turf quality. This assumes an irrigation schedule of three days per week, which may not be practical for many facilities.
Vigorous recovery of previously unirrigated bermudagrass occurred in autumn of 2012, but delayed recovery attaining only 25% green cover occurred following the 2013 season. Severely delayed recovery in 2013 suggests a possible cumulative effect of carbohydrate depletion as a result of unirrigated conditions over successive seasons. It should also be noted that temperatures and ET demand were much higher in 2013, which could have compounded the degree of stress in unirrigated bermudagrass. Conversely, bermudagrass cover in both deficit-irrigated treatments recovered to levels of the fully irrigated control during both autumn recovery periods.
These data suggest that applying even minimal amounts of irrigation during summer drought may be better than no irrigation at all in terms of ensuring bermudagrass survival. The challenge remains that golfers often prefer lush, green playing conditions, and changing golfer expectations to accept firmer, faster and slightly less aesthetically pleasing playing conditions across the golf course may be difficult.
Funding
This research was made possible through support from the Golf Course Superintendents Association of America’s Environmental Institute for Golf, the United States Golf Association Green Section, and the Lone Star chapter of Golf Course Superintendents Association of America.
Acknowledgments
This research was originally published as Hejl, R.H., Wherley, B.G., White, R.H., Thomas, J.C. and Fontanier, C.H. 2016. Deficit irrigation and simulated traffic on ‘Tifway’ bermudagrass summer performance and autumn recovery. Crop Science (doi:http://dl.sciencesocieties.org/publications/cs/articles/56/2/809).
Literature cited
- Brown, P., and D. Kopec. 2014. Converting reference evapotranspiration into turf water use. College of Agriculture and Life Sciences, University of Arizona (Tucson, Ariz.). (http://hdl.handle.net/10150/312654). Accessed March 21, 2016.
- Golf Course Environmental Profile, Phase II Volume I: Water Use and Conservation Practices on U.S. Golf Courses. (www.gcsaa.org/docs/default-source/Environment/phase-2-water-use-survey-full-report.pdf). Accessed March 21, 2016.
- Feldhake, C.M., R.E. Danielson and J.D. Butler. 1984. Turfgrass evapotranspiration. 11. Responses to deficit irrigation. Agronomy Journal 76.1:85-89.
- Fry, L.R., M.D. Richardson and D.E. Karcher. 2008. An improved method for simulating divot injury on turfgrass. Crop Science 48:2459-2462.
- Gibeault, V.A., S. Cockerham, J.M. Henry and J. Meyer. 1989. California turfgrass: Its use, water requirement and irrigation. California Turfgrass Culture 39. Cooperative Extension, University of California.
- McCarty, L.B. 2011. Best golf course management practices. Prentice-Hall, Upper Saddle River, N.J.
- Meyer, J.L., and V.A. Gibeault. 1987. Turfgrass performance when underirrigated. Applied Agricultural Research 2:117-119.
- Richardson, M.D., D.E. Karcher and L.C. Purcell. 2001. Quantifying turfgrass cover using digital image analysis. Crop Science 41:1884-1888.
- Schmitz, S.J., T.B. Voigt, B.E. Branham and T.W. Fermanian. 2005. Optimizing divot recovery. Golf Course Management 73(10):82-86.
- Steinke, K., J.C. Thomas, R.H. White, D.R. Chalmers, C.H. Fontanier and B. Wherley. 2013. Lateral spread of three warm-season turfgrass species as affected by prior water stress and root zone depth. HortScience 48(6):790-795.
- Williams, B.T., J.K. Kruse, J.B. Unruh and J.B. Sartain. 2010. Evaluating bermudagrass cultivars for traffic tolerance and recuperative ability. USGA Green Section Record 48:1-3.
B.G. Wherley is an assistant professor, R.W. Hejl is a research associate, and R.H. White is a professor in the Department of Soil and Crop Sciences at Texas A&M University, College Station, Texas. C.H. Fontanier, formerly a graduate student at Texas A&M, is currently an assistant professor in the Department of Horticulture and Landscape Architecture at Oklahoma State University in Stillwater, Okla.