From the March 2016 issue of GCM magazine:
Effects of nitrogen source, sulfur and fall fungicide applications on spring dead spot of bermudagrass
Once established, spring dead spot of bermudagrass is difficult to control, and a multiyear control program is currently still necessary.
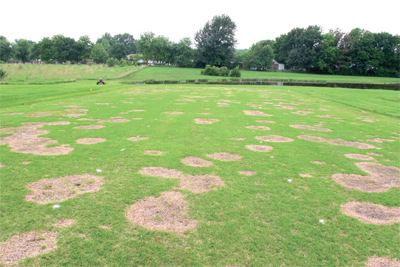
Symptoms of spring dead spot of bermudagrass include sunken, bleached circular patches that become noticeable as the healthy bermudagrass grows out of winter dormancy.
Photos by G.L. Miller
D.J. Cottrill, D.T. Earlywine and G.L. Miller, Ph.D.
Read this story in GCM's digital edition »
Spring dead spot (SDS) is a destructive disease of bermudagrass (Cynodon dactylon [L.] Pers.) and hybrid cultivars (Cynodon dactylon × C. transvaalensis Burtt-Davy) in areas where freezing temperatures induce bermudagrass dormancy. Spring dead spot pathogens are soilborne fungi that colonize bermudagrass roots, rhizomes and stolons. Although pathogen infection and colonization occur in cool soil temperatures (<70 F [<21 C]) in fall and winter, symptoms do not appear until spring. Sunken, bleached circular patches 1.2 inches to more than 3 feet (3 cm to > 1 meter) in diameter appear as uninfected bermudagrass resumes normal growth and comes out of winter dormancy. Below ground, dark runner hyphae are evident on infected roots and rhizomes, resulting in necrotic, black and brittle plant structures. Symptoms are often more severe on highly maintained, 3- to 5-year-old bermudagrass swards (8).
Spring dead spot is caused by three species in the genus Ophiosphaerella: O. herpotricha (Fr.), O. korrae and O. narmari. Ophiosphaerella herpotricha is found primarily in the Midwest, while O. korrae is the main spring dead spot pathogen species in the southeastern states and California. Although O. narmari has occasionally been isolated from infected bermudagrass tissue in Oklahoma, Kansas, North Carolina and California, it is not prevalent in the U.S. (4,11). The distribution of some species overlap, with O. herpotricha and O. korrae often appearing at the same site, and occasionally isolated from the same patch. All three species have been detected from the same site in Oklahoma (8,11).
Spring dead spot control
|
 |
|
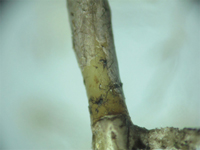
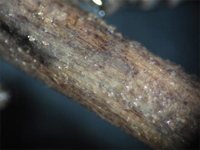
Spring dead spot infections occur below ground, where the fungi colonize bermudagrass roots, rhizomes and stolons. These photos show dark runner hyphae of the spring dead spot pathogen on infected rhizomes.
|
Spring dead spot is difficult to control because infection occurs below ground several months before symptoms are expressed, and fungicides must be delivered below the thatch layer. Once the disease becomes established, a combination of cultural and chemical practices is necessary in a multiyear approach to achieve acceptable control. Cultural practices include use of cold-tolerant bermudagrass varieties, core aerification, verticutting, soil pH manipulation and nitrogen fertilization (3,8,9).
Reducing soil pH. Ammonium sulfate, which reduces rhizosphere pH, has been shown to effectively control spring dead spot symptoms in several field studies (3,7). Conversely, calcium nitrate reduced symptoms caused by O. korrae, but not by O. herpotricha (7). Nitrification inhibitors (dicyandiamide and others) reduce nitrate leaching by slowing the conversion of NH4 to NO3, and may therefore be beneficial in cases where ammonium uptake and soil acidification suppress soilborne plant diseases. Another method of reducing soil pH is through elemental sulfur applications, although excessive applications may cause phytotoxicity and delay spring green-up (9).
Fungicide efficacy. Factors affecting fungicide efficacy include fungicide selection, method of application and application timing. Fungicides targeting spring dead spot must be applied preventively during fall, before or during the infection period (1). Among traditional fungicides reported to control spring dead spot are tebuconazole, propiconazole, benomyl, azoxystrobin and myclobutanil (1,6,8). Two fall fungicide applications or one fall and one spring fungicide application have offered the most effective and cost-effective disease control (10). Because spring dead spot pathogens are soilborne, the fungicide application must be either watered in with post-application irrigation or rainfall, or applied in a high volume of water carrier.
Objectives. The objectives of this research were to provide additional evidence for the geographic distribution of spring dead spot pathogens, and to investigate the impact of cultural practices and fungicide applications for spring dead spot control. The specific objectives were: (i) to sample and assess the diversity of spring dead spot pathogens in the Midwest region; (ii) to assess the impact of pH and nitrogen source on O. herpotricha and O. korrae in the lab; and (iii) to evaluate the impact of nitrogen source, sulfur, nitrification inhibitors and the fungicide tebuconazole on field spring dead spot symptoms caused by O. herpotricha.
Sampling and identification

In the field trial, nitrogen treatments were applied once a month in June, July and August to naturally infested plots at the University of Missouri Turfgrass Field Research Farm in Columbia, Mo.
Bermudagrass samples were collected at 16 locations exhibiting spring dead spot symptoms on golf course fairways, golf greens and athletic fields in Missouri, Arkansas and Kansas. At each site, samples were obtained from randomly selected individual patches in the symptomatic areas. Genomic DNA was extracted from 165 collected isolates and two reference isolates. The ITS region of collected isolates was amplified and sequenced for comparison with the reference isolates and sequences in GenBank (NCBI), an online database of annotated genetic sequences.
In vitro growth assays
The radial mycelial growth response to a range of pHs and two different nitrogen sources was determined for a subset of 42 isolates of O. herpotricha and eight isolates of O. korrae. For pH assessment, isolates were grown on potato dextrose agar (PDA) amended with either lactic acid or sodium hydroxide to obtain a range of pHs from 3 to 9. For nitrogen-source assessment, isolates were grown on a modified Melin-Norkrans (MMN) medium with ammonium sulfate [(NH4)2SO4] or calcium nitrate (CaNO3) added at 0, 50, 100, 200, 400 or 800 parts per million (ppm or µg/milliliter).
Naturally infested field trial
Materials and methods
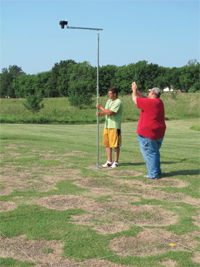
A camera mounted on a monopod was used to take digital images
of the diseased turf.
The images were analyzed
to determine disease severity.
A three-year field experiment was initiated in 2011 at the University of Missouri Turfgrass Field Research Farm in Columbia, Mo., to assess the impact of curative applications of nitrogen source, sulfur and tebuconazole on spring dead spot severity. The study was conducted on a Riviera bermudagrass research plot with a Mexico silt loam soil. The initial soil pH was 5.5 to 5.7, as measured from six random samples taken throughout the plot area in 2010. A natural occurrence of spring dead spot symptoms was observed across the plot area before trial initiation. The site was mowed at 0.75 inch (1.9 cm) three times a week and irrigated as needed to prevent drought stress. Plots were 5 feet × 10 feet (1.5 meters × 3 meters) and arranged in a strip-split-plot design with five replications. Nitrogen source was the main plot (strips), and sulfur and fungicide treatments were the subplots. Plots were not re-randomized between years to assess multiyear treatment impacts.
To determine the Ophiosphaerella species causing symptoms in the experimental plot, six samples were taken at random with a cup cutter from each replication, for a total of 30 samples.
Bulk soil pH and nutrient analysis. On Oct. 20, 2010, initial bulk soil pH and nutrient analysis was conducted on six samples taken randomly across the plot. Bulk soil pH was determined on Sept. 5, 2011 and May 30 and Aug. 22, 2013, by pulling one soil core 0.75 inch wide × 3 inches deep (1.9 cm × 7.62 cm) from each plot, and bulking the five replicates together to obtain one representative soil sample for each treatment. To determine irrigation water pH, on June 8, 2012, six samples (50 milliliters) of irrigation water were collected directly from irrigation heads and measured.
Nitrogen, sulfur and fungicide treatments. Treatments were initiated June 10, 2011. Nitrogen-source treatments included urea, ammonium sulfate, calcium nitrate, UMAXX and UFLEXX (Agrotain International) applied at a nitrogen rate of 1 pound nitrogen/1,000 square feet (49 kilograms/hectare) once a month in June, July and August using a drop spreader. UMAXX and UFLEXX contain the urease inhibitor N-(n-butyl) thiophosphoric triamide and the nitrification inhibitor dicyandiamide. At the same time the nitrogen was applied, flowers of sulfur (MFA Inc.) was applied at 2 pounds/1,000 square feet (98 kilograms/hectare) using a hand broadcast spreader.

†A = Ophiosphaerella herpotricha, B = O. korrae, C = O. narmari
Table 1. Collection date, location, bermudagrass cultivar and ribosomal DNA (rDNA) clade for sequences of Ophiosphaerella species obtained from bermudagrass exhibiting spring dead spot symptoms.
Tebuconazole was applied as Torque (Cleary Chemicals) at a product rate of 0.6 fluid ounce/1,000 square feet (0.82 kilogram a.i./hectare) either once a year on Oct. 14 or twice a year on Sept. 16 and Oct. 14. Tebuconazole was applied in water equivalent to 2 gallons/1,000 square feet (7.57 liters/92.9 square meters) with a CO2-powered sprayer calibrated to 30 psi using TeeJet 8008 nozzles.
All nutrient and fungicide treatments were watered in with 0.2 to 0.24 inch (5 to 6 mm) of overhead irrigation water immediately after application.
Disease assessment. To establish a baseline for each plot, disease severity was assessed on June 10, 2011, before the trial was initiated. Disease symptoms were most evident in the plot area during complete green-up of uninfected bermudagrass, which occurred on May 22 or May 23 in all three years. Percent control was calculated on May 22, 2012 and May 23 in 2013 and 2014.
Visual disease severity ratings were taken for all field trials by estimating the percentage of foliar spring dead spot symptoms in a single plot. Digital images were also obtained on June 10, 2011; May 22, June 8 and June 22, 2012; May 23, June 10 and June 24, 2013; and May 23, June 6 and June 20, 2014. Photos of each plot were taken with a D90 Nikon DSLR camera mounted on a 10-foot-high (3-meter-high) monopod centered directly above the plot area. Images were analyzed with Sigma-
Scan Pro 5.0 (Systat Software Inc.) using image editing and batch analysis macros designed by Karcher and Richardson (5). The area under the disease progress curve (AUDPC) was calculated for each year, and data were analyzed.
Results
Species distribution
Of the 213 fungi isolated from symptomatic tissue, 165 were putative Ophiosphaerella species identified by comparison with GenBank accessions and reference isolates (Table 1). Overall, O. herpotricha was found at all 16 locations and made up 93% of the collected isolates (n = 154), and O. korrae was isolated from six locations and made up 6% of the isolates (n = 10). Only one isolate of O. narmari was found, in a Patriot bermudagrass research plot established in 2012 at the University of Missouri research site. Ophiosphaerella herpotricha and O. korrae were isolated once from the same turfgrass sample.
In vitro mycelial growth assay
Radial mycelial growth was greater for O. korrae than for O. herpotricha in pH and solid- nitrogen media assessments.
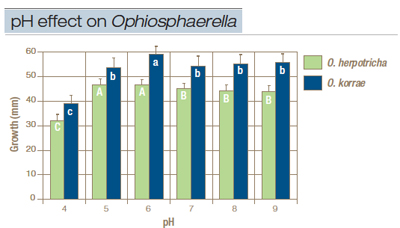
Figure 1. Growth of Ophiosphaerella herpotricha and O. korrae after 12 days on potato dextrose agar (PDA) adjusted to a pH range of 3 to 9 with NaOH or lactic acid. No growth occurred on media amended to pH 3. Within species, columns with the same letter are not statistically different.
pH. Radial mycelial growth was significantly influenced by pH. No growth was recorded for either species at pH 3. Growth was significantly lower for both species at pH 4 compared with higher pH treatments. Radial growth of O. korrae was significantly higher at pH 6 than at other pH treatments (Figure 1), but was not significantly different among pH 5, 7, 8 and 9. Radial growth of O. herpotricha was significantly higher at pH 5 and 6 than for other pH treatments (Figure 1). Growth was not significantly different for O. herpotricha among pH treatments of 7, 8 and 9.
Nitrogen source. Nitrogen source and concentration significantly affected radial growth on liquid-amended media. Radial mycelial growth of O. herpotricha and O. korrae isolates was greater on calcium nitrate-amended MMN media than on ammonium sulfate-amended MMN media. No differences in radial growth of O. korrae were observed among calcium nitrate-amended media concentrations, and few differences in growth of O. herpotricha were observed. Radial growth of O. korrae was significantly lower on MMN media amended with 100, 200, 400 and 800 ppm ammonium sulfate compared with 50 ppm ammonium sulfate and no nitrogen (Figure 2). Similarly, radial growth of O. herpotricha was highest on 50 ppm ammonium sulfate and no nitrogen (Figure 2).
Field study
Initial bulk soil pH on October 2010 averaged 5.36. In subsequent analysis, plots receiving sulfur averaged a pH of 5.52, which was slightly lower than that of plots not receiving sulfur (5.61). No substantial differences were observed in any soil nutrient levels among analyses conducted on Oct. 20, 2012; May 30, 2013; or Aug. 22, 2013 (data not shown). Irrigation water pH was slightly alkaline (7.5 to 8.0). All 30 isolates of Ophiosphaerella species recovered from the field site were identified as O. herpotricha.
A significant difference between years was observed for both digital image analysis and visual estimates of disease severity. Data from each year was therefore analyzed separately. Correlation was weaker at later rating dates because of visual differentiation between sulfur phytotoxicity and spring dead spot symptoms that was not discerned in digital image analysis. During periods of high disease severity, visual estimates were consistently higher than estimates obtained from digital imaging analysis.
Nitrogen source did not significantly affect spring dead spot severity. On May 22, 2012, sulfur treatments significantly reduced spring dead spot severity, and in 2013 reduced AUDPC (Figure 3). A significant interaction of nitrogen source and sulfur occurred in May 2013 and 2014 as estimated with digital image analysis. Delayed spring green-up was observed on May 23, 2013, in plots receiving both ammonium sulfate and sulfur. On May 23, 2014, all plots receiving sulfur were delayed in spring green-up, with ammonium sulfate being most affected. In both years, digital image analysis was unable to discern between dormant and diseased turf during the spring green-up period (Figure 3).
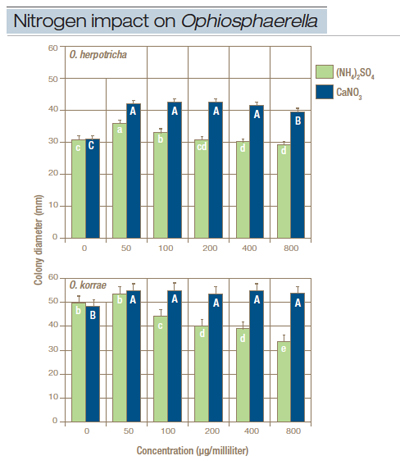
Figure 2. Growth of (top) Ophiosphaerella herpotricha and (bottom) O. korrae on modified Melin-Norkrans (MMN) medium amended with either ammonium sulfate or calcium nitrate at 0 to 800 µg/milliliter. Within nitrogen source, columns with the same letter are not statistically different. Least square means are averaged across all isolates. Error bars represent the standard error of the means.
Fungicide treatments significantly reduced AUDPC in each year and on most rating dates. Plots treated either once or twice with tebuconazole had lower AUDPC values in 2012 than untreated plots without sulfur treatment did (Figure 3). In 2013, the AUDPC of plots treated with one tebuconazole application with and without sulfur or with two applications without sulfur were not significantly different from plots treated with sulfur alone. In all three years, no significant difference in spring dead spot severity was detected between one and two fall tebuconazole applications per year (Figure 3).
Discussion
Based on DNA analysis, O. herpotricha was the predominant spring dead spot pathogen detected in Missouri and the surrounding region, which has been suggested as a native region for this species (11). On occasion, O. korrae was also isolated from infected bermudagrass tissue, indicating an overlapping species distribution. Ophiosphaerella narmari was isolated from a single spring dead spot sample obtained from a 1-year-old Patriot bermudagrass block vegetatively propagated the previous year with plant material imported from Oklahoma. This pathogen species is therefore likely not widely distributed in Missouri, but may be introduced occasionally with distributed plant material.
Ophiosphaerella herpotricha is considered the most aggressive of the three spring dead spot pathogen species (8) and was isolated from 13 different cultivars in this study. Spring dead spot was commonly observed on cold-tolerant cultivars such as Patriot and Riviera, suggesting cold-tolerant cultivars are also susceptible to spring dead spot pathogen infection. More research is needed to screen the susceptibility of new bermudagrass cultivars to spring dead spot, and to determine whether host susceptibility varies among spring dead spot species or by climatic region.
Effects of nitrogen or soil pH
Previous research indicates nitrogen source and/or soil pH may play an important role in suppressing spring dead spot. Field studies report a decrease in spring dead spot symptoms when bulk soil pH is reduced below 5.5 (3,9). However, O. herpotricha and O. korrae grew well at pH 5 and higher in our in vitro study. Maintaining a bulk soil pH below 5 would be challenging and may lead to nutrient deficiencies, but only the rhizosphere pH may need this level of acidity during the infection period, which may occur transiently along the root surface when ammonium ions are acquired. Accurately separating and comparing bulk and rhizosphere pH in plants possessing a fibrous root system is difficult, but may need to be determined to fully understand the pH interaction with the spring dead spot pathogen.
No difference was detected between the in vitro responses of O. herpotricha and O. korrae to calcium nitrate or ammonium sulfate concentrations, as both grew equally well on calcium nitrate and poorly on ammonium sulfate. Unlike previous reports (3,7), our field study also did not indicate a reduction in spring dead spot severity from nitrogen source. Ammonium sulfate applications have been observed to reduce spring dead spot caused by O. korrae in Maryland (3). The only spring dead spot species found in this field plot was O. herpotricha. Ophiosphaerella herpotricha is considered more aggressive than O. korrae, and that may explain the difference between these results. In North Carolina, ammonium sulfate suppressed spring dead spot caused by O. herpotricha (7). Soil pH at our site was initially low (~5.5), and perhaps the impact of ammonium sulfate application on rhizosphere pH was not as prevalent. Irrigation water pH at our research site was also slightly alkaline (pH 7.5 to 8), which may have minimized the potential for soil pH reduction from ammonium nitrogen forms. Last, and perhaps most important, this study was conducted on a site with a widespread spring dead spot epidemic caused by O. herpotricha, whereas the previous study was performed on inoculated plots evaluating preventive fertility treatments. After infection, O. herpotricha colonizes the root cortex of susceptible cultivars (2) and may not need to reinfect the plant from the root surface every year to reproduce symptoms. Therefore, changing rhizosphere pH with nitrogen source may have a reduced effect or require a multiyear integrated control strategy for rehabilitation of established epidemics.
Effect of sulfur applications
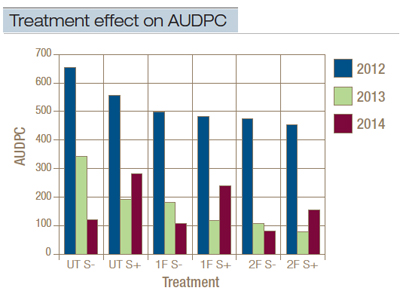
Figure 3. Effect of nitrogen source, sulfur and fungicide applications on the area under the disease progress curve (AUDPC) values derived from digital image analysis assessments of spring dead spot caused by O. herpotricha. UT = no fungicide treatment; 1F = one fall tebuconazole application applied on Oct. 14; 2F = two fall tebuconazole applications applied on Sept. 16 and Oct. 14; S – = no sulfur; S + = sulfur applied at 2 pounds nitrogen/1,000 square feet in June, July and August.
Sulfur applications resulted in a reduction in spring dead spot severity similar to that of a single fungicide application without sulfur in 2013. Sulfur applications have the potential to lower soil pH, but no considerable differences were detected in bulk soil pH in sulfur-treated plots in this study. A low initial soil pH, the buffering capacity of the soil, or the alkaline pH of the irrigation water could have prevented sustained bulk-soil acidification by the sulfur applications. Rather than acidifying the soil, the sulfur applications may directly inhibit the pathogen by acting as a fungicide. Delayed spring green-up and premature winter dormancy were observed in plots receiving sulfur beginning in spring and fall 2013. This effect was exacerbated in plots also treated with ammonium sulfate, so sulfur rates may need to be reduced or discontinued to decrease the possibility of this effect. This observation of delayed spring green-up is in agreement with previous research (9).
Fungicide applications
After one year, one or two fall fungicide (tebuconazole) applications reduced disease compared with the untreated plots, but control was still unacceptable. Therefore, two years of fungicide applications may be necessary to achieve desirable control levels. One fungicide application per year provided statistically as much control as two fungicide applications per year in all three years of the study. One application may thus be more cost-effective in a multiyear management system. Conversely, an 81% reduction in spring dead spot symptoms was reported after one year with two fall applications of propiconazole (10). This difference in fungicide efficacy may stem from the different active ingredient used, or from the higher volume of post-application irrigation (0.4 to 0.5 inch [10 to 13 mm]) used for fungicide delivery in the previous study.
This research indicates curative management of spring dead spot can be achieved through a multiyear integrated strategy combining sulfur and fungicide applications. Future research integrating reduced sulfur rates to minimize plant side effects, intense cultivation practices (for example, frazing), micronutrient applications, and different fungicide application strategies is needed to develop management recommendations aimed toward reducing fungicide requirements and increasing control efficacy.
Acknowledgments
This research was supported with funding from the Ozark Turfgrass Association and the Mississippi Valley Golf Course Superintendents Association. We thank B. Fresenburg and R. Kremer for review and constructive comments, M. Ellersieck for statistical advice, K. Robertson for valuable technical assistance, and L.P. Tredway and E.L. Butler (North Carolina State University) for providing fungal isolates from their collections.
This research was originally published as: Cottrill, D.J., Earlywine, D.T, and Miller, G.L. 2015. Assessment of nitrogen source, sulfur, and fall fungicide applications on the management of spring dead spot of bermudagrass. Plant Disease (doi: http://dx.doi.org/10.1094/PDIS-05-15-0565-RE).
Literature cited
- Butler, E.L., and L.P. Tredway. 2006. Methods and timing of fungicide applications for control of spring dead spot in hybrid bermudagrass. Online. Plant Health Progress doi:10.1094/PHP-2006-0901-01-RS.
- Caasi, O.C., N.R. Walker, S.M. Marek, J.N. Enis and T.K. Mitchell. 2010. Infection and colonization of turf-type bermudagrass by Ophiosphaerella herpotricha expressing green or red fluorescent proteins. Phytopathology 100:415-423.
- Dernoeden, P.H., J.N. Crahay and D.B. Davis. 1991. Spring dead spot and bermudagrass quality as influenced by nitrogen source and potassium. Crop Science 31:1674-1680.
- Iriarte, F.B., H.C. Wetzel, J.D. Fry, D.L. Martin and N.A. Tisserat. 2004. Genetic diversity and aggressiveness of Ophiosphaerella korrae, a cause of spring dead spot of bermudagrass. Plant Disease 88:1341-1346.
- Karcher, D.E., and M.D. Richardson. 2005. Batch analysis of digital images to evaluate turfgrass characteristics. Crop Science 45:1536-1539.
- McCarty, L.B., L.T. Lucas and J.M. DiPaola. 1992. Spring dead spot occurrence in bermudagrass following fungicide and nutrient applications. HortScience 27:1092-1093.
- Tredway, L.P., M.D. Soika and E.L. Butler. 2009a. Response of spring dead spot caused by Ophiosphaerella korrae and O. herpotricha to fertilization programs and preventive fungicide applications. Phytopathology 99:S129.
- Tredway, L.P., M. Tomaso-Peterson, H. Perry and N.R. Walker. 2009b. Spring dead spot of bermudagrass: a challenge for researchers and turfgrass managers. Online. Plant Health Progress doi:10.1094/PHP-2009-0710-01-RV.
- Vincelli, P., and D. Williams. 2005. Managing spring dead spot of bermudagrass. Online publication. (www.ca.uky.edu/agc/pubs/id/id130/id130.htm).
- Walker, N.R. 2009. Influence of fungicide application timings on the management of bermudagrass spring dead spot caused by Ophiosphaerella herpotricha. Plant Disease 93:1341-1345.
- Wetzel, H.C., D.Z. Skinner and N.A. Tisserat. 1999. Geographic distribution and genetic diversity of three Ophiosphaerella species that cause spring dead spot of bermudagrass. Plant Disease 83:1160-1166.
D.J. Cottrill was a graduate student, D.T. Earlywine is a research assistant, and G.L. Miller is an assistant professor in the Division of Plant Sciences at the University of Missouri, Columbia, Mo.