From the October 2016 issue of GCM magazine:
Survey documents innovation in pest management practices
Golf courses in the U.S. have increased their reliance on alternatives to conventional pesticides, using them in partnership with conventional chemistries to optimize pest management.
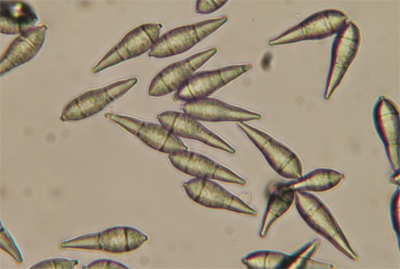
Spores of gray leaf spot, one of several diseases that dominate pest control practices.
Photos by Larry Stowell
Wendy Gelernter, Ph.D., and Larry Stowell, Ph.D.
Read this story in GCM's digital edition »
This study was conducted by GCSAA through the Environmental Institute for Golf and was funded by the United States Golf Association (USGA).
In the past decade, researchers in the industry and at universities have introduced many environmentally friendly pest management practices and products to the world of turf management. But how widely have these practices been adopted? And what barriers — be they regulatory, economic, educational or otherwise — have stood in the way?
This article addresses these questions by summarizing the data from national surveys that were conducted by GCSAA to characterize trends in pest management practices in 2007 and 2015.
Pest management practices and the Golf Course Environmental Profile
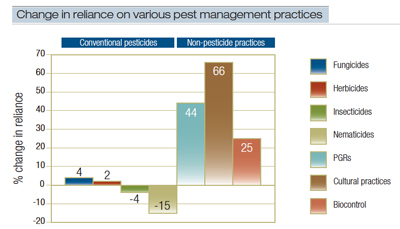
Figure 1. Percent change in reliance by all facilities on various pest management practices over the past several years. Values were determined by subtracting the percentage reporting decreased reliance from the percentage reporting increased reliance on each pest management practice.
In 2006, GCSAA and the Environmental Institute for Golf (EIFG) initiated a project to conduct a series of five surveys to document water use, fertilizer use, pest management practices, energy use, environmental stewardship and property profiles. Known as the Golf Course Environmental Profile, the results provided a baseline of information for use in the management of golf facilities, as well as an important tool for communicating within the golf course industry and with regulators, legislators and the general public. Results were published in scientific journals (15-17,31,32) and online on the EIFG website.
In fall 2014, the second phase of the Golf Course Environmental Profile began, with a follow-up set of surveys that mirrored the previous series. The surveys are to be conducted by GCSAA through the EIFG and funded by the United States Golf Association (USGA). Results of Phase II surveys for water use, nutrient use and pest management have already been published (9-11).
†NA (practices were surveyed only in 2015)
*Significant difference (P < 0.10) between 2007 and 2015
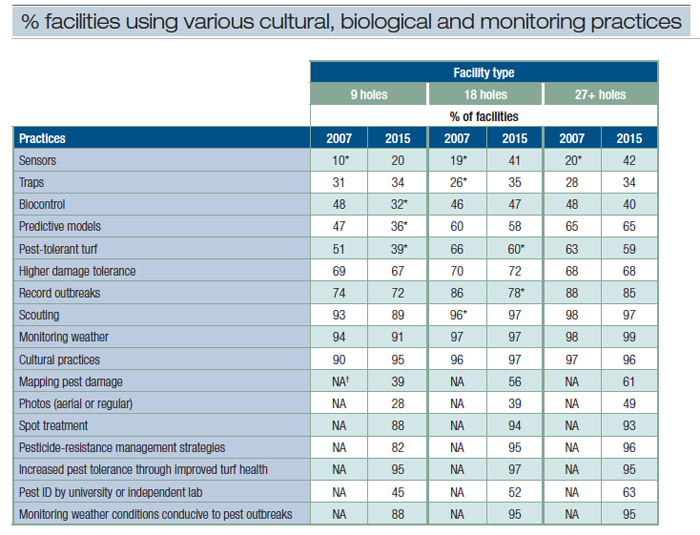
Table 1. Percentage of facilities using various cultural, biological and monitoring practices “sometimes” or “frequently.” For each golf course size (nine, 18 and 27+ holes), practices in 2007 were compared with those in 2015.
Trends in pest management practices
Over the past several years, U.S. golf courses have increased their reliance on alternatives to conventional pesticides, such as cultural practices, plant growth regulators and biological controls. In contrast, reliance on conventional chemistries such as fungicides, herbicides, insecticides and nematicides has either decreased or stayed the same.

Plant growth regulators, such as ethephon and trinexapac-ethyl, have been used as replacements for herbicides in management of annual bluegrass on putting greens. A green infested with Poa annua is shown on the left, and a plot on the same green treated with a PGR is pictured on the right.
Cultural, monitoring and biological practices
Since 2007, reliance on the use of cultural practices has increased by 66%. (Figure 1). These cultural practices were used by more than 90% of facilities with nine, 18 and 27+ holes in both 2007 and 2015 (Table 1). The practices focus on modifying the pest’s environment or habitat in such a way that pest numbers or pest damage is reduced. Increased mowing heights, salinity management, fertilizer management, and improving plant health are commonly used cultural practices on golf courses.
Other non-pesticide practices frequently used in both 2007 and 2015 (Table 1) include monitoring weather, scouting for pests, recording outbreaks, and tolerating higher levels of plant damage. In addition, the practices of pesticide resistance management, spot treatment with pesticides, and encouragement of improved turf health were reported by a large majority of respondents in 2015; questions on these practices were not included in the 2007 survey, however.
The practice that has increased the most since 2007 is the use of sensors. Sensors are hand-held or machine-mounted devices that gather information on soil or plant characteristics to allow superintendents to better manage turf health and, therefore, resilience against pest attack. Sensor use has probably increased since 2007 because sensor technology is relatively new (2) and is still in the early, rapid adoption phase.
†Numbers indicate references in the “Literature cited” section
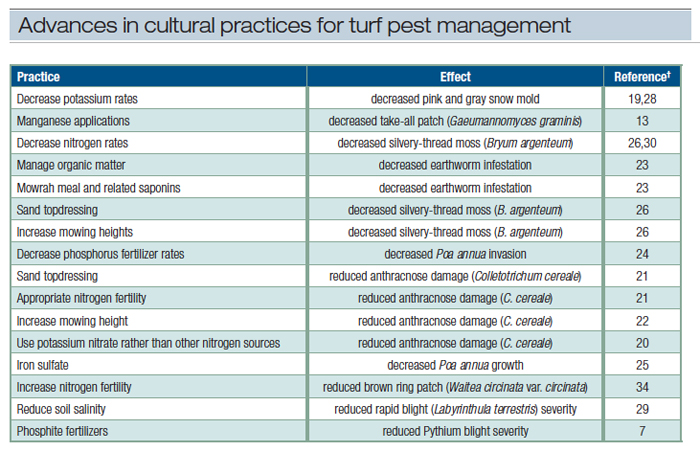
Table 2. Recent research advances in the use of cultural practices for turf pest management.
Facilities with nine, 18 and 27+ holes demonstrated similar trends over time in adopting these practices, though nine-hole facilities were less likely to use these techniques than larger courses were (Table 1).
Significant applied research on the role of cultural practices in pest management (Table 2) in recent years may have played a role in the large increase in reliance on these strategies.
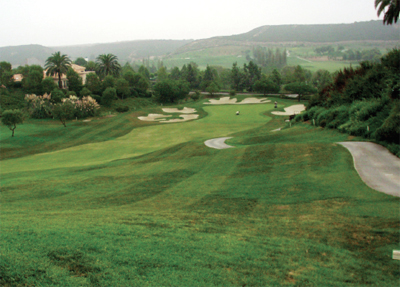
Gray leaf spot can devastate large swaths of ryegrass, kikuyugrass and St. Augustinegrass during the warm, humid summer months.
Plant growth regulators
Since 2007, reliance on the use of plant growth regulators (PGRs) has increased by 44% (Figure 1). These products are generally assigned the lowest toxicity classification by the Environmental Protection Agency (27). They are used to improve turf quality and stress tolerance, and to suppress the growth of certain weeds and diseases (14,22). Although PGRs have been available for several decades, recent advances in technology have resulted in improved scheduling of these products as well as the introduction of newer products that have reduced the risk of phytotoxicity associated with early PGRs (18).
Biological control
Reliance on the use of biological controls has increased by 25% since 2007 (Figure 1). These products and practices rely on the use of natural extracts or byproducts and a naturally occurring predator, parasite or pathogen to control pests. The recent introduction of effective biopesticide products based on active ingredients such as polyoxin-D (derived from the microbe Streptomyces) and phosphites/phosphonates (based on salts and esters of phosphorous acid) has very likely contributed to increased reliance on biocontrols (3,4).
Conventional pest control practices
Of the conventional pesticides, nematicides had the largest decrease in use since 2007 (Figure 1). This is very likely due to the EPA’s 2008 prohibition of the sale and distribution of the nematicide fenamiphos (1), which had been widely used in the golf course industry. Reliance on fungicides, herbicides and insecticides changed very little between 2007 and 2015.
Pest management decision-making
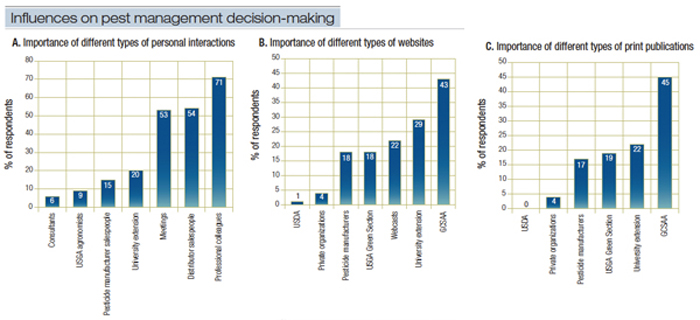
Figure 2. Role of personal interactions (A), websites (B) and print publications (C) in pest management decision-making for all facilities. Percent of respondents in 2015 who viewed each information source as one of the five most influential for information on pest management strategies.
The most important/influential sources of information on pest management strategies in 2015 (Figure 2) were, in decreasing order: personal interactions, websites and print publications. Since this set of questions was asked for the first time in 2015, the data presented here serves as a baseline for future survey analyses.
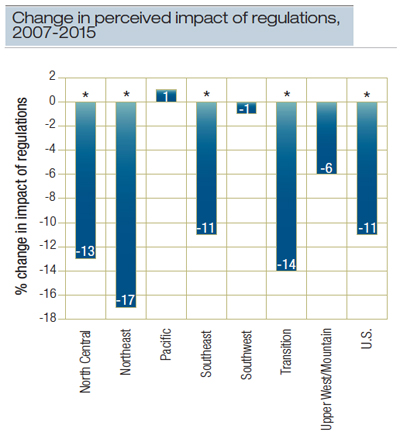
Figure 3. Figure 3. Percent change in perceived impact of regulations, from 2007 to 2015, for 18-hole facilities. For each region, an asterisk indicates a significant difference (P < 0.10) between 2007 and 2015.
Personal interactions
Almost all (98%) respondents indicated that one or more types of personal interactions were in the top five of their most influential information sources on pest management. Of these sources, individuals or organizations with whom superintendents interact most frequently (professional colleagues, distributor salespeople and people at meetings) appear to have the greatest influence (Figure 2A).
Websites
Websites were the second most popular general information source, with 87% of respondents listing one or more websites as highly influential. The most frequently cited websites were sponsored by GCSAA and state university extension organizations (Figure 2B).
Print publications
One or more print publications were cited by 79% as highly influential. The most frequently cited publications were sponsored by GCSAA, university extension and the USGA Green Section (Figure 2C).
Trends in pest management regulations
In general, superintendents reported that restrictions on pest management programs did not interfere with pest management decision-making in both 2007 and 2015. However, the degree to which superintendents felt that pesticide restrictions influenced their pest management programs has shown a significant downward trend since 2007, particularly in the North Central, Northeast, Southeast and Transition regions (Figure 3).
State and local regulations
Federal regulations (including pesticide labeling) cover almost all aspects of pesticide operations and applications. In some locations, however, additional pesticide regulations are issued by local governments (state, city/town, county, tribe, etc.).
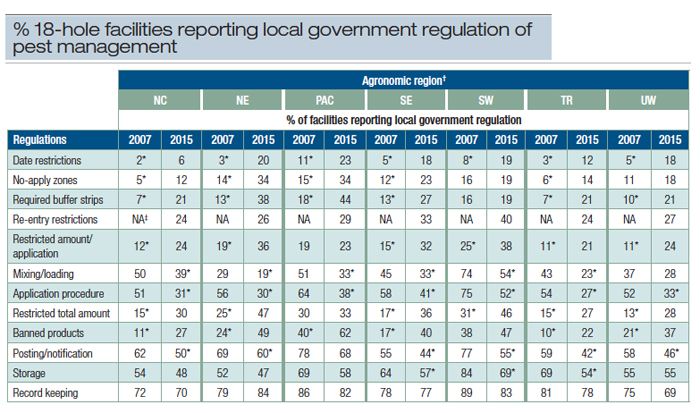
†Agronomic regions: NC, North Central; NE, Northeast; PAC, Pacific; SE, Southeast; SW, Southwest; TR, Transition; and UW, Upper West/Mountain
‡NA (practices were surveyed only in 2015)
*Significant difference (P < 0.10) between 2007 and 2015
Table 3. Percentage of 18-hole facilities reporting local government regulation (above and beyond federal regulations) of various pest management activities. For each region, regulations in 2007 were compared with those in 2015.
*Significant difference (P < 0.10) between 2007 and 2015
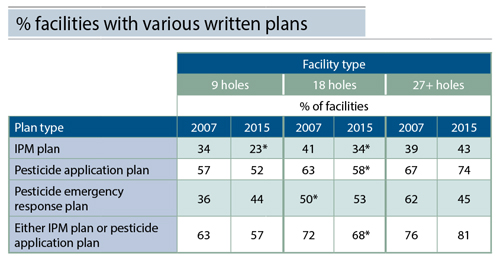
Table 4. Percentage of facilities with various written plans. For each golf course size (nine, 18 and 27+ holes), plan types in 2007 were compared with those in 2015.
Respondents were asked which pesticide-related activities are regulated by local governments above and beyond the federal regulations that they comply with. The biggest changes since 2007 were increases in product bans, restrictions on amounts of some products, and requirements for buffer strips, no-apply zones and date restrictions (Table 3).
Pesticide applicator certifications
Federal law requires any person who applies or supervises the use of restricted-use pesticides to be certified in accordance with federal EPA regulations as well as any appropriate state, territorial and tribal laws. The EPA requires additional restrictions on the use of “restricted-use pesticides,” which the agency says would otherwise have the potential to cause adverse effects on the environment and/or injury to applicators or bystanders (5).
The number of Certified Pesticide Applicators at each golf facility has remained relatively unchanged since 2007, with an average of 1.2, 2.1 and 3.6 applicators for facilities with nine, 18 and 27+ holes, respectively. These numbers equal approximately one certified applicator for every nine holes on the golf course. However, states are now moving to certify all applicators on golf courses, regardless of whether restricted-use pesticides are used.
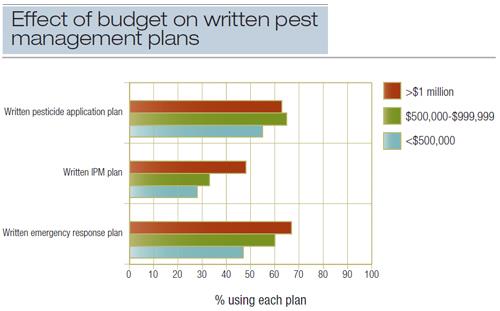
Figure 4. Effect of golf facility annual budget on the development of written pest management plans for all golf facilities, 2015.
National Pollutant Discharge Elimination System
The National Pollutant Discharge Elimination System (NPDES) program is a hybrid federal/state program that requires a permit placing limits on the discharge of potential point-source pollutants to “Waters of the United States” (WOTUS). In 2011, aquatic pesticide applications to WOTUS were included in this program (8). The permitting is administered by state governments in 44 states, and the Environmental Protection Agency retains oversight responsibilities in six states (6). In the 2015 survey, 4% of respondents (data not shown) said they had been required to physically obtain an NPDES pesticide general permit. Automatic permit coverage is provided in most states and with the EPA if aquatic pesticide applications fall under a threshold level.
Written plans
Written plans covering pesticide use include pesticide emergency response plans, integrated pest management (IPM) plans and pesticide application plans. These plans are used for the purposes of planning, communication, coordination and safety. Written plans need to be regularly updated in order to be considered viable. For this reason, understanding how the use of written plans has changed since the 2007 survey is helpful.
*Significant difference (P < 0.10) between 2007 and 2015
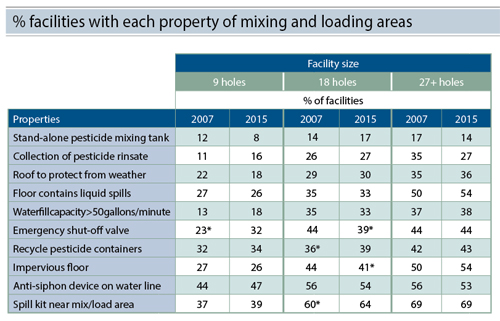
Table 5. Percentage of facilities with each property of mixing and loading areas. For each golf course size (nine, 18 and 27+ holes), mixing/loading properties in 2007 were compared with those in 2015.
Written integrated pest management plans
An integrated pest management plan is a written, comprehensive document that contains the strategies and tactics that will be implemented to manage pests on the golf course. Golf course superintendents have several resources available when developing a written IPM plan, from those provided at a national level (12) to those provided by state university/extension programs or environmental organizations. IPM strategies and tactics include:
- Integration of cultural, biological and chemical controls as a means of minimizing hazards to humans and the environment
- Pest monitoring
- Pest identification
- Pest damage thresholds
In 2015, there was a significant decrease in the number of nine-hole and 18-hole facilities reporting the use of an IPM plan (Table 4). This trend toward fewer IPM plans was observed in both public and private facilities, as well as in most agronomic regions (data not shown).
Of those reporting the use of written IPM plans, the majority of IPM plans (85%) were voluntary projects, either in cooperation with a non-regulatory organization (such as a watershed protection or environmental organization), or they were initiated by the superintendent.
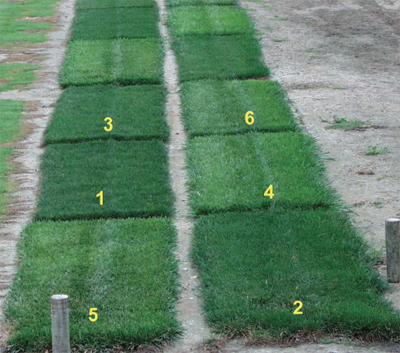
Adoption of new turf varieties that have been bred for tolerance to disease, salinity, drought and other stressors is one of several strategies employed to reduce reliance on conventional pesticides.
One likely reason for the decrease in development of IPM plans is the downward shift in the U.S. economy that occurred after the 2007 survey was completed, and the concomitant downsizing of golf course maintenance budgets, which would have resulted in less time and fewer resources available for development of such plans. In addition, research, education and promotion of golf course turf IPM — by both universities and private organizations — has decreased since the 2007 survey, and, as a result, less information and support are available for superintendents interested in this process.
For example, a search of articles (both peer-reviewed and in trade journals) with the words “golf” and “IPM” or “golf” and “integrated pest management” in the titles revealed a 32% decrease in such articles for the years 2008 to 2015 (150 articles) compared with the period from 2000 to 2007 (221 articles) (33).
Written pesticide application plan
Pesticide application plans are written documents that list all pesticide applications (and may include nutrient and plant growth regular applications as well) planned for the year. These plans are used by superintendents for multiple purposes, including the development of budgets, staffing plans and product ordering. A golf facility may have a written pesticide application plan that works in conjunction with a written IPM plan. While these facilities may develop and use both types of plans, some may use one or the other, or neither.
Pesticide application plans were the most frequently used written plan, most likely because of their pragmatic nature. The decline in their use at nine-hole and 18-hole facilities since 2007 (Table 4) may be due to the same economic and educational factors discussed previously for IPM plans. The reasons given for development of these plans were similar to those provided for IPM plans, with voluntary projects comprising 85% of all reported plans.
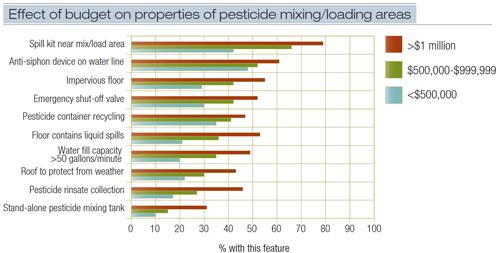
Figure 5. Effect of golf facility annual budget on the properties of pesticide mixing and loading areas for all golf facilities, 2015.
*Significant difference (P < 0.10) between 2007 and 2015
Written pesticide emergency response plan
These plans are designed to prepare the staff to respond effectively if an accident should occur within the pesticide operation or the pesticide storage area. In 2015, the use of these plans had not changed significantly (Table 4).
Role of budget and facility size
In general, golf courses with larger budgets and/or larger golf courses were more likely to have written pest management plans of all types than those with lower budgets or smaller courses (Figure 4, Table 4). This is likely due to the added labor involved in developing and administering the plan and keeping it up-to-date.
Pesticide handling
Pesticide mixing and loading
Only small changes have taken place in the attributes of mixing and loading areas since 2007 (Table 5). The most common features were the nearby location of spill kits and anti-siphoning devices on the water line. Anti-siphon functions can also be filled via air gaps between the fill line and the mixing or spray tank. This option was not provided to respondents, however. For this reason, the actual percentage of facilities with anti-siphoning functions is probably higher than the values shown in Table 5. Increasing the relatively low percentage of facilities with an overhead roof or with either impervious floors or floors that contain liquid spills should be focused on in the future.
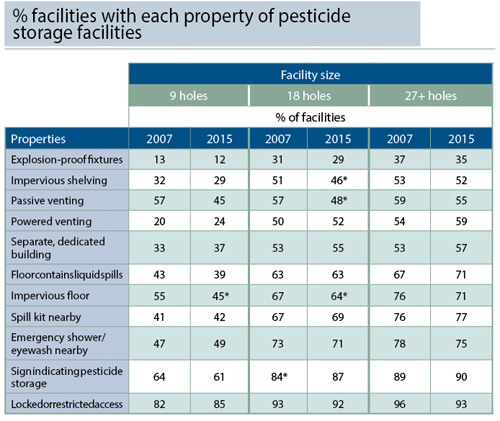
Table 6. Percentage of facilities with each property of pesticide storage facilities. For each golf course size (nine, 18 and 27+ holes), storage facility properties in 2007 were compared with those for 2015.
Larger facilities consistently reported greater use of mixing and loading features (Table 5), and there was also a clear and direct relationship between a golf facility’s annual budget and the attributes of its mixing and loading stations (Figure 5). For example, less than 30% of facilities with budgets of less than $500,000 per year had some of the most basic safety requirements, such as floors with impervious surfaces and overhead enclosures. In contrast, 55% of facilities with budgets of greater than $1 million annually had mixing and loading stations with floors with impervious surfaces, and 43% had stations protected by a roof or overhead enclosure.
This data indicates that facilities with smaller golf courses and/or lower budgets will continue to be inhibited from adopting many of these attributes.
Pesticide storage
The large majority of respondents (97% in 2007 and 99% in 2015) stored pesticides on-site. The most common features reported in both years were, in descending order: locked or restricted access; signage indicating pesticides are stored inside; emergency shower or eyewash located nearby; spill kit near storage area; impervious floor; flooring that contains liquid spills; use of a separate, dedicated building; and use of powered venting.
The primary purpose of pesticide storage facilities is to contain pesticide products in case of accidents so that humans and the environment are protected. Because of this, they should be secure, dry, well lit, well ventilated, and protected from extreme weather.
The frequency with which most storage features are used has changed only slightly since 2007 (Table 6). This may be a function of the occurrence of the Great Recession in the years since 2007 and the concomitant lack of investment in high-cost features when new facilities were being built.

Figure 6. Effect of golf facility annual budget on properties of pesticide storage facilities, for all golf facilities, 2015.
As seen for mixing and loading features, larger facilities consistently reported greater use of storage features (Table 6). There was also a clear and direct relationship between a golf facility’s annual budget and the attributes of its pesticide storage facilities. Some of the largest discrepancies between facilities with large budgets versus those with smaller budgets were in the use of a separate, dedicated building for pesticide storage; impervious shelving; powered venting; and the use of explosion-proof fixtures (Figure 6). These trends suggest that facilities with smaller golf courses and/or lower budgets will continue to be inhibited from adopting many of these attributes.
How the study was done
An initial email invitation, which included a link to an online survey, was sent to 13,652 U.S. golf courses in October 2015, and was followed by three email reminders. A total of 1,946 completed surveys were received, representing a 12.6% response. This is somewhat lower than the 20.8% response from the 2007 survey.
PACE Turf and the National Golf Foundation (NGF) were contracted to develop and implement the survey, as well as to analyze, summarize and publish reports on the data.
To gain insights into survey data, respondents were stratified by agronomic region (Figure 7), as well as by golf course type, number of holes and green fees.
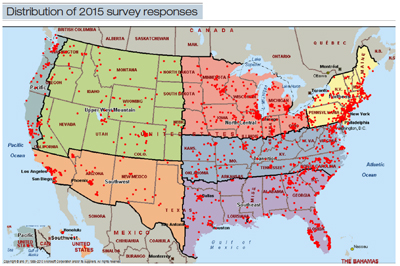
Figure 7. Distribution of 2015 survey responses received in seven different agronomic regions.
To ensure the data was representative of the broad spectrum of golf facilities in the nation, responses were weighted so that the diversity in golf course size, type and geographic location were accurately reflected in the survey data. When data was restricted to specific regions or specific golf course sizes, weighted data was not used.
Conclusions and recommendations
The adoption of written pesticide plans as well as costly improvements in pesticide storage facilities and pesticide mixing and loading stations have decreased since the initial 2007 survey. This is likely a result of the downward shift in the economy that took place after the 2007 survey was completed. As the economy recovers, greater emphasis should be placed on encouraging golf facilities to improve the safety features of pesticide storage and mixing/loading areas, and to incorporate written pest management plans into their programs.
Further improvements in pest management efficacy and safety will rely on greater investment by golf courses in staff education and safety-related facility improvements; by universities and superintendent associations in research, outreach and education on new pest management strategies; and by companies in continued development of new, environmentally compatible and efficacious pest management products.
Funding
This study was conducted by GCSAA through the Environmental Institute for Golf and funded by the United States Golf Association (USGA).
Literature cited
- Bradbury, S. 2008. Fenamiphos: amendment to use deletion and product cancellation order. Federal Register, Dec. 10, 2008, 73(238):75097-75099.
- Carrow, R.N., J. Krum and C. Hartwiger. 2009. Precision turfgrass management: a new concept for efficient application of inputs. USGA Turfgrass and Environmental Research Online 8(13):1-12.
- Cook, J., P. Landschoot and M. Schlossberg. 2006. Phosphonate products for disease control and putting green quality. Golf Course Management 74(4):93-96.
- Copping, L.G., and S.O. Duke. 2007. Natural products that have been used commercially as crop protection agents. Pest Management Science 63:524-554.
- Environmental Protection Agency. 2015. How to get certified as a pesticide applicator. EPA Pesticide Worker Safety website. (http://www.epa.gov/pesticide-worker-safety/how-get-certified-pesticide-applicator). Accessed Jan. 20, 2016.
- Environmental Protection Agency. 2016. National Pollutant Discharge Elimination System (NPDES). United States Environmental Protection Agency NPDES website. (http://www.epa.gov/npdes). Accessed Jan. 20, 2016.
- Ervin, E.H., D.S. McCall and B.J. Horvath. 2009. Efficacy of phosphite fungicides and fertilizers for control of Pythium blight on a perennial ryegrass fairway in Virginia. Online. Applied Turfgrass Science doi: 10.1094/ATS-2009-1019- 01-BR
- Federal Register. 2015. Clean Water Rule: Definition of “Waters of the United States.” Vol. 80, No. 124/Monday, June 29, 2015/Rules
- Gelernter, W.D., L.J. Stowell, M.E. Johnson and C.D. Brown. 2016a. Documenting trends in nutrient use and conservation practices on U.S. golf courses. Crop, Forage & Turfgrass Management doi: 10.2134/cftm2015.0225
- Gelernter, W.D., L.J. Stowell, M.E. Johnson and C.D. Brown. 2016b. Documenting trends in pest management practices on U.S. golf courses, Crop, Forage & Turfgrass Management doi: 10.2134/cftm2016.0032
- Gelernter, W.D., L.J. Stowell, M.E. Johnson, C.D. Brown and J.F. Beditz. 2015. Documenting trends in water use and conservation practices on U.S. golf courses. Crop, Forage & Turfgrass Management doi: 10.2134/cftm2015.0149
- Golf Course Superintendents Association of America. 2015. Welcome to the IPM Planning Guide. (http://www.gcsaa.org/environment/ipm-guide). Accessed Jan. 20, 2016.
- Heckman, J.R., B.B. Clarke and J.A. Murphy. 2003. Optimizing manganese fertilization for the suppression of take-all patch disease on creeping bentgrass. Crop Science 43:1395-1398.
- Huang, B. 2007. Plant growth regulators: what and why. Golf Course Management 75(1):157-160.
- Lyman, G.T., M.E. Johnson, G.A. Stacey and C.D. Brown. 2012a. Golf course environmental profile measures energy use and energy management practices. Applied Turfgrass Science doi: 10.1094/ATS-2012-0228-01-RS
- Lyman, G.T., M.E. Johnson, G.A. Stacey and C.D. Brown. 2012b. Golf course environmental profile measures pesticide use practices and trends. Applied Turfgrass Science doi: 10.1094/ATS-2012-1220-01-RS
- Lyman, G.T., C.S. Throssell, M.E. Johnson, G.A. Stacey and C.D. Brown. 2007. Golf course profile describes turfgrass, landscape and environmental stewardship features. Applied Turfgrass Science doi: 10.1094/ATS-2007-1107-01-RS
- McCarty, B. 2015. Plant growth regulators used in turfgrass management. Clemson Cooperative Extension Turfgrass Management. (www.clemson.edu/extension/horticulture/turf/pest_guidelines/growth_regulators.html). Accessed Feb. 11, 2016.
- Moody, D., and F. Rossi. 2010. Potassium fertilization affects psychrophilic pathogen susceptibility of annual bluegrass. ASA, CSSA and SSSA 2010 International Annual Meeting, Long Beach, Calif. Abstract.
- Murphy, J., B. Clarke, C. Schmid, J. Hempfling and R. Wang. 2013. Best management practices for anthracnose disease on annual bluegrass putting greens. USGA Turfgrass and Environmental Research Online 12:16-17. (usgatero.msu.edu/v12/n2-16.pdf).
- Murphy, J., B. Clarke, C. Schmid, J. Hempfling and R. Wang. 2014. Best management practices for anthracnose disease on annual bluegrass putting greens. USGA Turfgrass and Environmental Research Online 13:12-17. (usgatero.msu.edu/v13/n2-12.pdf).
- Murphy, J., J. Inguagiato and B. Clarke. 2012. Best management practices for anthracnose on annual bluegrass. Golf Course Management 80(5):104-110.
- Potter, D.A., C.T. Redmond and D.W. Williams. 2013. Managing excessive earthworm casting on golf courses and sport fields. International Turfgrass Society Research Journal 12:347-355.
- Raley, R.B., P.J. Landschoot and J.T. Brosnan. 2013. Influence of phosphorus and nitrogen on annual bluegrass encroachment in a creeping bentgrass putting green. International Turfgrass Society Research Journal 12:649-655.
- Reams, N., X. Zhang and E. Ervin. 2012. An integrated nutritional and chemical approach to Poa annua control in creeping bentgrass putting greens. ASA, CSSA and SSSA International Annual Meetings, Cincinnati, Ohio. Abstract.
- Raudenbush, Z., S.J. Keeley and L.R. Stark. 2015. Managing silvery-thread moss in golf course greens. Golf Course Management 83(10):72-77.
- Reilly, S.K., L.K. Lake, W.E. Shafer and R.S. Jones. 2002. Regulation of biochemical plant growth regulators at the U.S. Environmental Protection Agency. HortTechnology (12):55-58.
- Soldat, D. 2014. Decreased pink snow mold associated with low soil potassium. The Grass Roots May/June.
- Stowell, L.J., S.B. Martin, M. Olsen, D. Bigelow, M. Kohout, P.D. Peterson, J. Camberato and W.D. Gelernter. 2005. Rapid blight: A new plant disease. APSnet Features doi: 10.1094/APSnetFeature/2005-0705
- Thompson, C., M. Kennelly and J. Fry 2011. Effect of nitrogen source on silvery-thread moss on a creeping bentgrass putting green. Online. Applied Turfgrass Science doi: 10.1094/ATS-2011-1018-02-RS
- Throssell, C.S., G.T. Lyman, M.E. Johnson, G.A. Stacey and C.D. Brown. 2009a. Golf course environmental profile measures nutrient use management and fertilizer restrictions, storage and equipment calibration. Applied Turfgrass Science doi: 10.1094/ATS-2009-1203-01-RS
- Throssell, C.S., G.T. Lyman, M.E. Johnson, G.A. Stacey and C.D. Brown. 2009b. Golf course environmental profile measures water use, source, cost, quality, and management and conservation strategies. Applied Turfgrass Science doi: 10.1094/ATS-2009-0129-01-RS
- Turfgrass Information File. 2016. Michigan State University. (http://tic.msu.edu). Accessed Jan. 25, 2016.
- Wong, F.P., C. Chen and L. Stowell. 2009. Effects of nitrogen and Primo MAXX on brown ring patch development. Golf Course Management 77(5):117-121.
Wendy Gelernter (www.paceturf.org) and Larry Stowell are the principals of PACE Turf in San Diego.